
Executive Summary
The U.S. life insurance industry strengthened its liquidity as companies navigated the pandemic crisis and business uncertainties over the last two years. Broad sector allocations remained stable, with bonds and mortgage loans combined representing 83% of total invested assets. In 2021, the industry’s annual net investment income (%) increased marginally, largely driven by alternative assets, which tend to be predominately owned by large organizations.
Fixed income durations extended marginally over the last two years, after having stayed relatively unchanged previously, likely driven by asset-liability matching requirements. Over the last decade, fixed income credit quality gradually declined, while industry book yield decreased by 123 basis points (bps).
Broad Sector Allocations Largely Unchanged
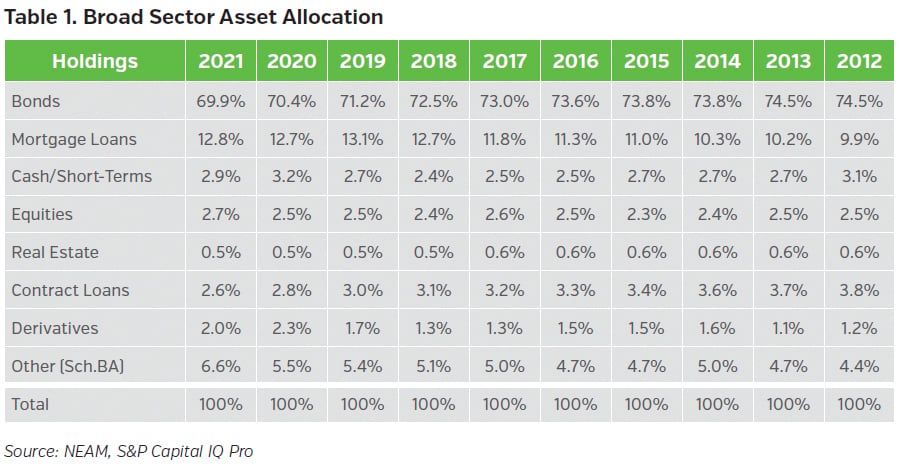
The U.S. life insurance industry’s statutory asset allocation across broad sectors remained mostly unchanged for 2021 (see Table 1). Faced with the pandemic crisis, inflation pressures and business uncertainties, the industry strengthened its liquidity through additional cash and short-term holdings over the last two years. Bonds remained the largest sector, although the allocation continued to decline year over year. The allocation to mortgage loans, the second largest sector, increased slightly in 2021, after a short-lived decline observed in 2020. The allocation to Schedule BA assets reached a new high of 6.6% in 2021 and remained highly concentrated among large organizations.
Investment Income Increased Slightly, Thanks to Alternatives
Table 2 highlights the industry’s total cash and investments and earned investment income on a gross and net basis. Over the last decade, the industry’s total cash and investments grew 44% from $3.4tn to $4.9tn, while net investment income ($) rose by only 21% from $165.1bn to $199.4bn. In 2021, thanks to an outsized contribution from Schedule BA assets (see Table 3), the industry’s annual net investment income (%) increased by 7 bps, which was the second year of annual increase over the last 10 years.
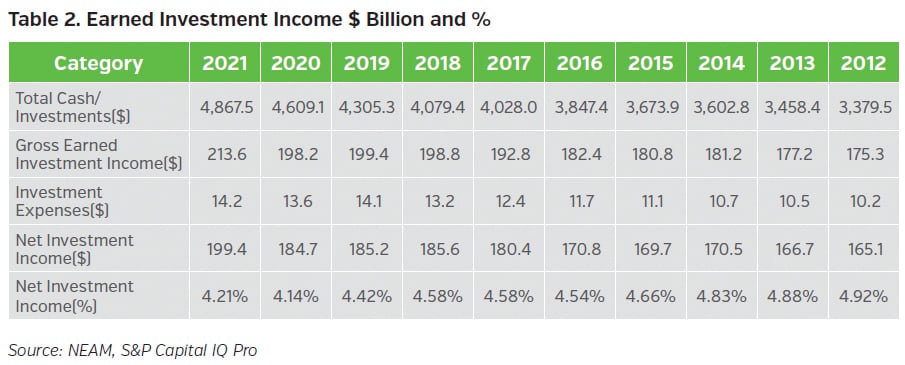
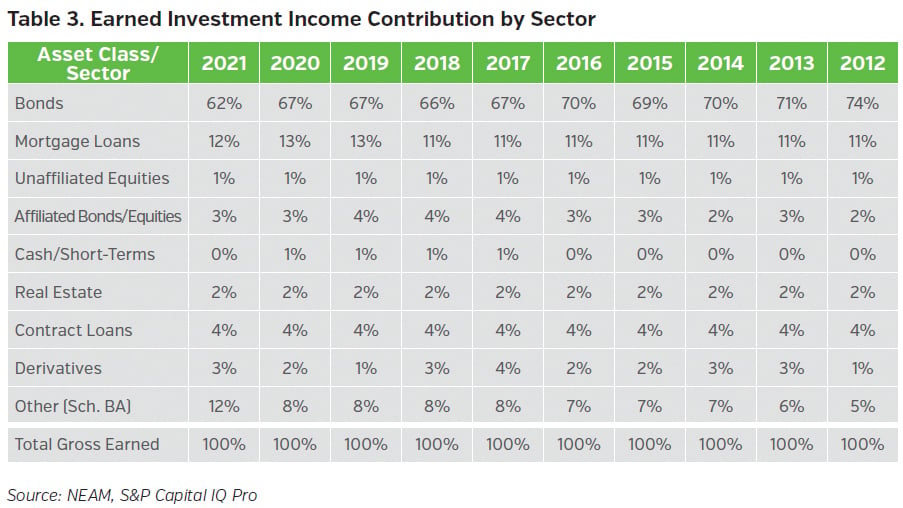
Table 3 displays the industry’s earned investment income contribution from broad asset sectors. Bonds and mortgage loans combined contributed three quarters of the total, while the contribution from unaffiliated equities represented merely 1%. In 2021, the contribution from Schedule BA assets increased significantly and represented a level similar to that of mortgage loans.
Fixed Income Allocation: Private Placements Growing, Structured Sector Shrinking
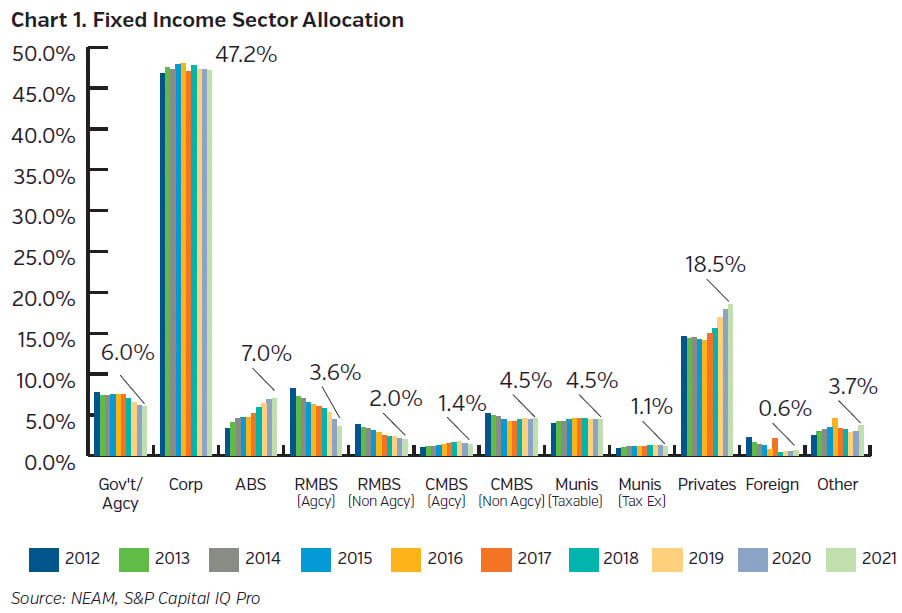
Chart 1 displays secular trends in fixed income sector allocations over the past decade. Corporate and private placements represent the largest two sectors. The corporate allocation remained relatively unchanged while the private placement allocation continued to grow over time. As noted in prior publications, unlike statutory Schedule D Part 1A reporting, our reported private placement category excludes publicly traded 144A securities.
The allocation to structured securities (i.e., ABS, CMBS and RMBS) declined from a high of 30%1 prior to the 2008 financial crisis to 18.5% at year-end 2021. Within structured securities, the ABS sector has continued to grow and has partially offset the declining allocation to the RMBS sector.
The allocation to taxable municipal bonds rose from less than 1% prior to the 2008 financial crisis to 4.5% in 2015 and has remained at that level. The increase in this allocation began in 2009 and 2010, after the passage of the “American Recovery and Reinvestment Act.” This Act led to the creation of “Build America Bonds,” which allowed municipalities and municipal authorities to raise debt, with the federal government providing a direct subsidy of the interest cost.
Book Yield Declined, Despite Ongoing Duration Extension and Credit Risk Taking
The industry’s book yield declined steadily by a total of 123 bps over the last decade (see Table 4). In 2021, the overall book yield experienced an annual decline of 18 bps, although the industry’s aggregate net investment income (%) increased (see Table 2). Yield declines were observed across all sectors. Cumulative reductions of 190 bps in the book yields of Non-agency RMBS and Non-agency CMBS since 2012 reflect the runoff of seasoned pre-crisis exposures with higher embedded book yields.
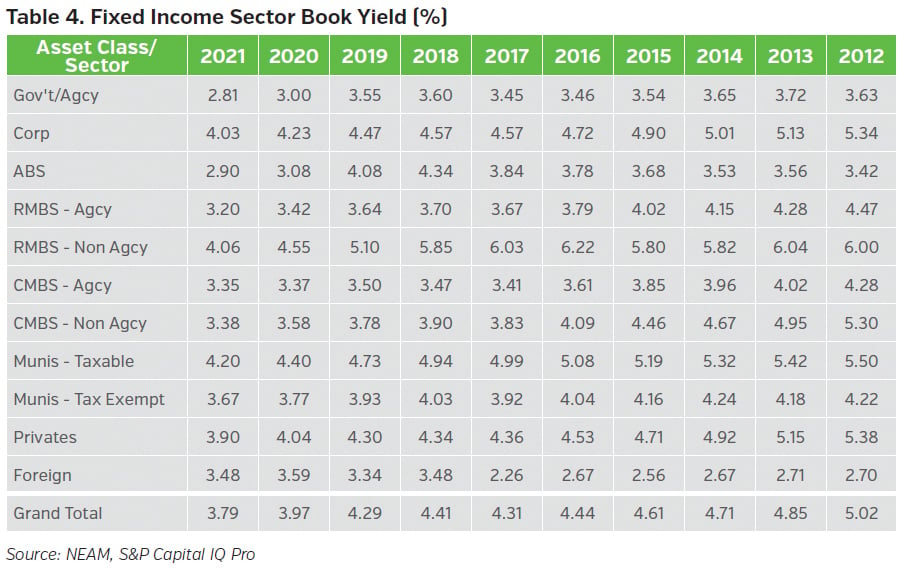
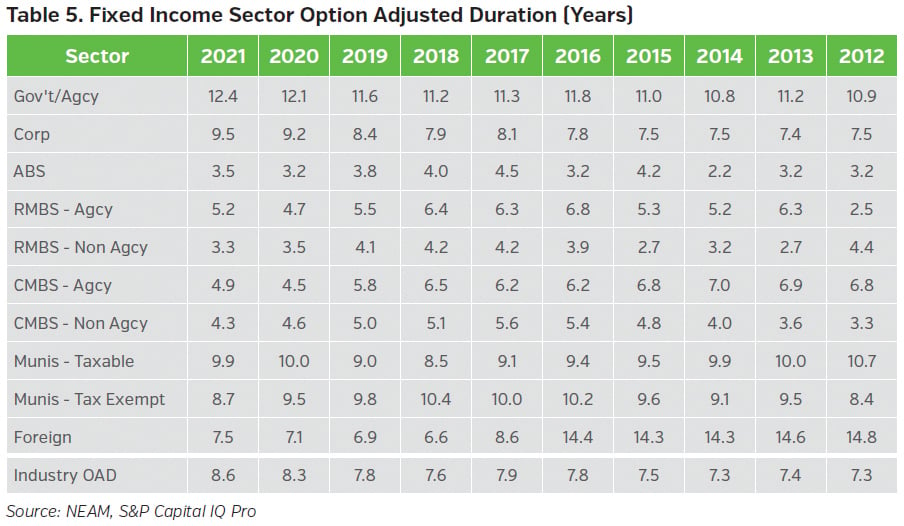
Table 5 displays option-adjusted duration (OAD) by fixed income sector. The OAD statistics are based upon CUSIP-level holdings extracted from Schedule D statutory filings and exclude any bonds held at the holding company level, derivatives and private placement securities. The industry’s OAD was 5.5 years1 right before the 2008 financial crisis and then gradually extended to 7.8 years through 2016. From 2016 to 2019, the industry’s OAD remained relatively unchanged, likely driven by asset liability matching requirements. The duration extension seen in 2020 coincided with broad-based bond duration extension resulting from Fed’s accommodative policy. However, the industry’s additional duration lengthening of 0.3 years observed in 2021 contrasted with the duration shortening seen in the broad corporate, government and municipal bond indices2 and appeared deliberate.
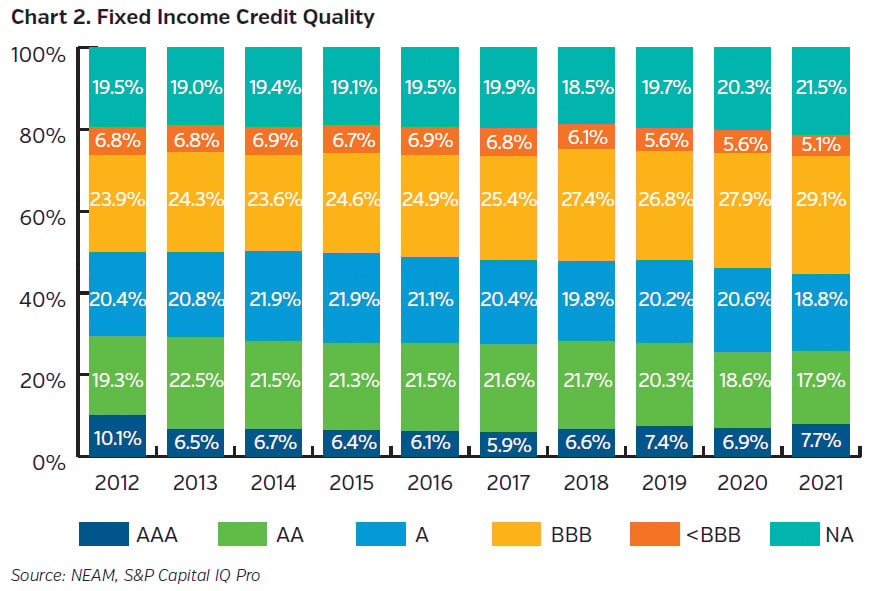
Over the last 10 years, the allocation to AAA, AA, and A securities (NAIC 1 category) decreased from 49.8% to 44.3%, while the BBB category increased from 23.9% to 29.1% (see Chart 2). The BBB allocation grew sizably over the last year and reached a new high. The below investment grade (<BBB) allocation declined from highs of 6.9% from 2012 to 2017 to the lowest of 5.1% at year-end 2021.
The NA category consists of mostly “true”3 private placement securities, which accounted for 18.5% of total fixed income holdings in 2021 (see Chart 1). Based on historical statutory filings, about half of the industry’s private placement securities fell into the BBB (NAIC 2) rating category. This is much higher than the BBB allocation observed in public fixed income securities (see Chart 2).
All Credit Rating Categories Exhibited Yield Decline and Duration Extension
Chart 3 displays the book yields for public fixed income securities by credit rating category. In 2021, total fixed income book yields declined across all rating categories. Over the past 10 years, the higher rating categories, AAA and AA, experienced the least reduction (95 bps), while the BBB category experienced the most (141 bps).
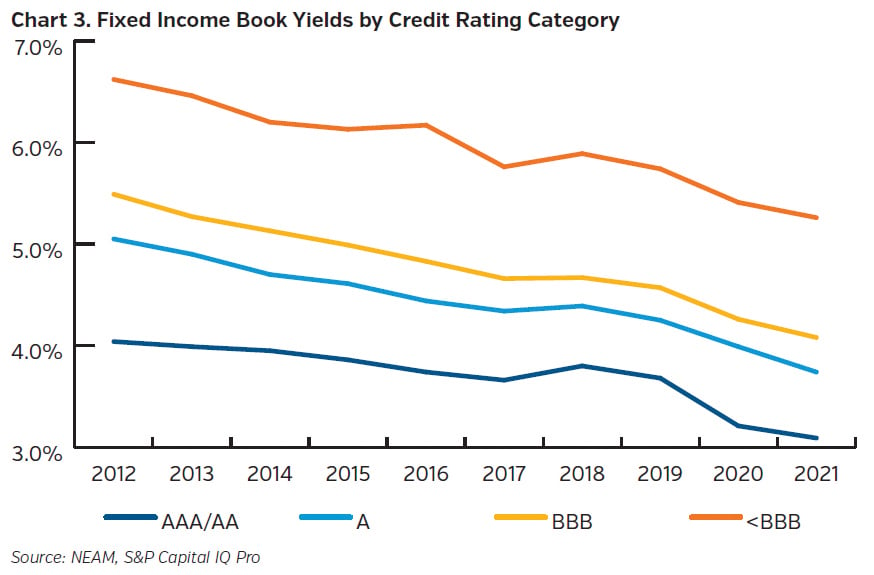
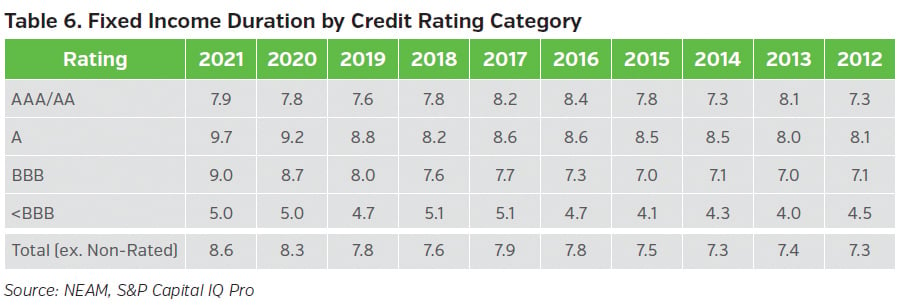
Table 6 displays the OAD for public fixed income securities by credit rating category. High yield (<BBB) bonds typically exhibit shorter durations than investment grade bonds. In 2021, durations extended across all rating categories, except for the below investment grade (<BBB) category. Non-rated securities (primarily private placements), which accounted for 21.5% (see Chart 1) of total fixed income holdings in 2020, were not included in the aggregate duration calculation.
Key Takeaways
- Faced with the pandemic crisis, inflation pressures, and business uncertainty, the industry strengthened its liquidity by holding additional cash and short-term holdings, although the broad sector allocations remained relatively unchanged.
- The industry’s investment income increased marginally, thanks to Schedule BA assets. Alternatives allocations reached a new high in 2021 and their contribution to the industry’s investment income reached the level of contribution equal to that of mortgage loans.
- Within the fixed income portfolio, allocations to private placement securities and ABS continued to trend upward, while allocations to RMBS exhibited declines. The industry’s book yield has declined by 123 bps over the past decade, while duration extended by 1.3 years.
- Although the industry’s high yield (<BBB) allocation reached a new low in 2021, the BBB allocation for public fixed income securities had risen steadily since 2012. Private placements, which represented 18.5% of the total fixed income holdings in 2021, comprise approximately 50% of BBB-rated securities.
Please contact us if you would like to receive a customized assessment, which facilitates in-depth comparisons and contrasts of enterprise characteristics of your company relative to peer organizations. The assessment supports decisions with enterprise risk preferences and investment strategy.
Endnotes
1 Please see prior issues of NEAM Perspectives – U.S. Life Industry Investment Highlights.
2 Observations based on ICE index: C0A0, G0A0, and U0A0.
3 “True” private placement category excludes any 144A securities that are publicly traded.


