
Executive Summary
The U.S. P&C insurance industry strengthened its liquidity as companies navigated the pandemic crisis and business uncertainties in 2020 and 2021. During this period, interest rates remained low as central banks supported the economy with ample liquidity.
With the Fed’s accommodative policy, 2021 turned out to be another year of stellar performance for equity markets. The industry risk asset allocations reached another new high and yet, the industry’s investment return continued to decline. Overall net investment income experienced a 107 basis point (bps) reduction, with book yield now 120bps lower than it was 10 years ago.
At the time of this writing (July 2022), the 10-year Treasury yield was 140bps higher than it was at year-end 2021, thanks to central banks’ actions to cope with elevated inflation. We believe an insurer’s asset return seeking (and risk taking) needs to be evaluated within a holistic framework where enterprise objectives, underwriting characteristics, and business profiles are incorporated.
Liquidity Strengthened Amid Uncertainties
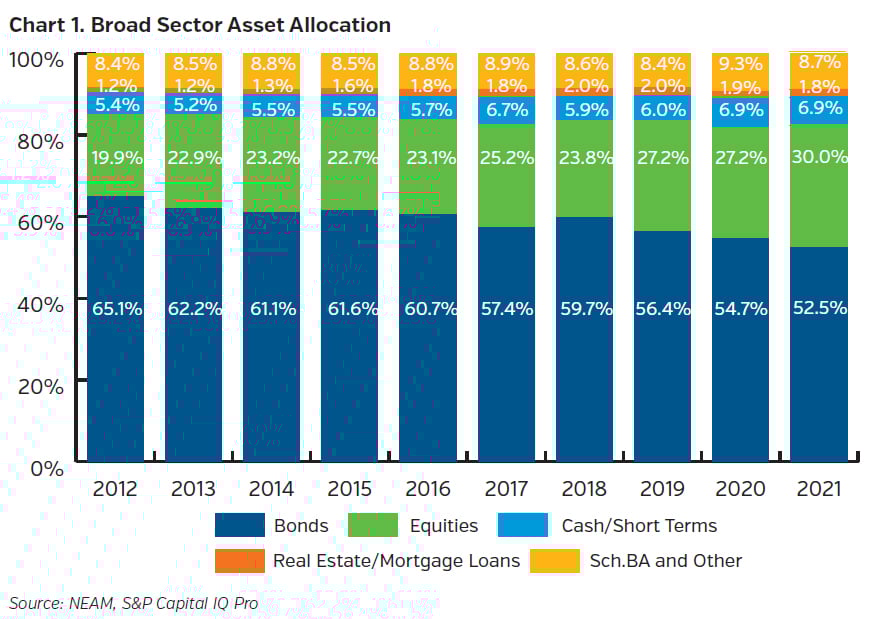
Chart 1 shows the industry’s statutory asset allocation across broad sectors over the last decade. Faced with the pandemic crisis, inflationary pressure, and business uncertainties, the industry strengthened and maintained its liquidity through additional cash and short-term holdings over the last two years. Bonds remained the majority of the total invested assets, although the allocation continued to decline year over year. The industry’s growing equity allocation has been largely driven less by deliberate allocation to the sector than by stock market appreciation.
Risk Asset Allocation Reached Another New High
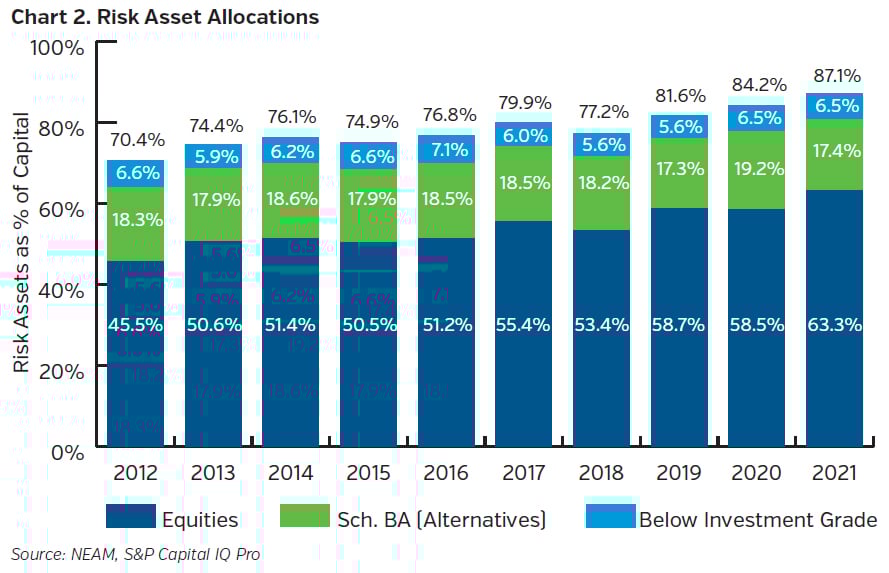
The industry’s allocation to risk assets continued to rise and reached a new high (87.1% of surplus) at year-end 2021 (Chart 2). The allocation to equities represented 63% of the industry’s surplus, while Schedule BA and below-investment-grade allocations remained less than 25%. The data suggests an implied barbell risk-taking approach where high quality, liquid and short duration investment grade fixed income portfolio allocations are combined with a risk asset allocation dominated by equities. To understand the potential implications of owning risk assets, we encourage insurers to utilize a holistic enterprise framework that incorporates underwriting characteristics and business profiles in their asset allocation analysis.
Net Investment Income (%) Continued to Decline
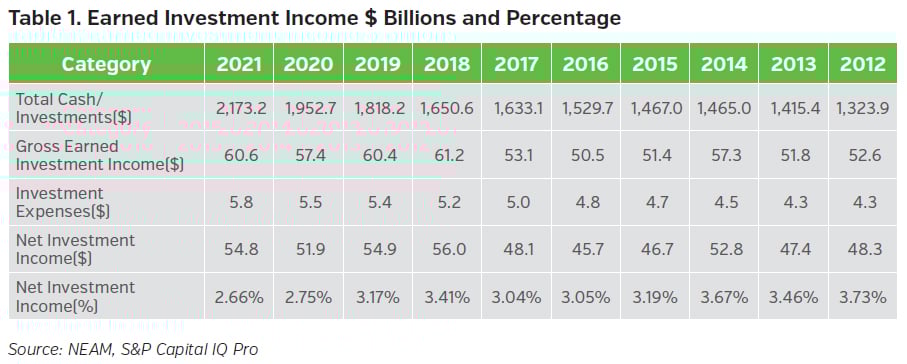
Table 1 highlights the industry’s total cash and investments and earned investment income on a gross and net basis. Over the last decade, the industry’s total cash and investments ($) increased by 64% while net investment income ($) rose by only 14%. In 2021, the industry’s total cash and investments grew by 11%, driven partially by written premium growth, but the net investment income (%) fell 9bps compared to 2020.
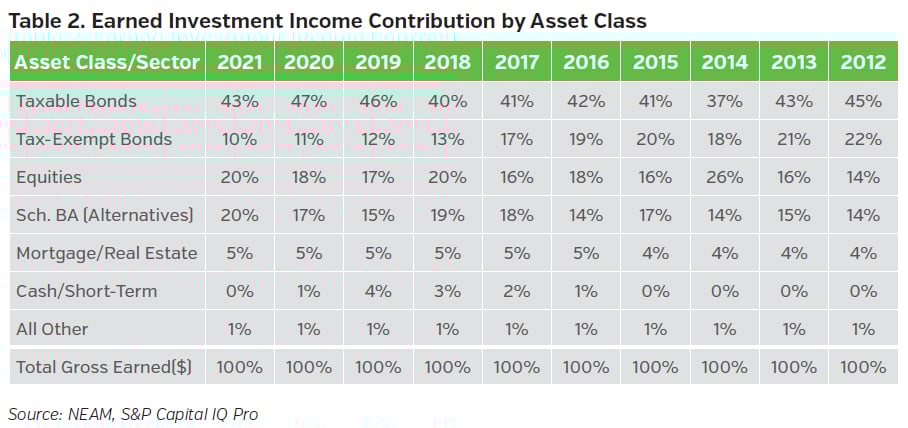
We further examine the industry’s earned investment income contribution from major asset classes (Table 2). In 2021, the contribution from equities and alternatives outpaced the contributions from taxable and tax-exempt bonds. The contribution to net investment income from tax-exempt bonds decreased from 22% in 2012 to 10% in 2021. This reduction reflected both a lower remaining embedded book yield level as higher yielding assets mature and a reduction in holdings, due to diminished tax advantages from changes made to the tax laws in 2017.
Fixed Income Allocation: Corporate Sector Growing, Tax-Exempt Municipal Shrinking
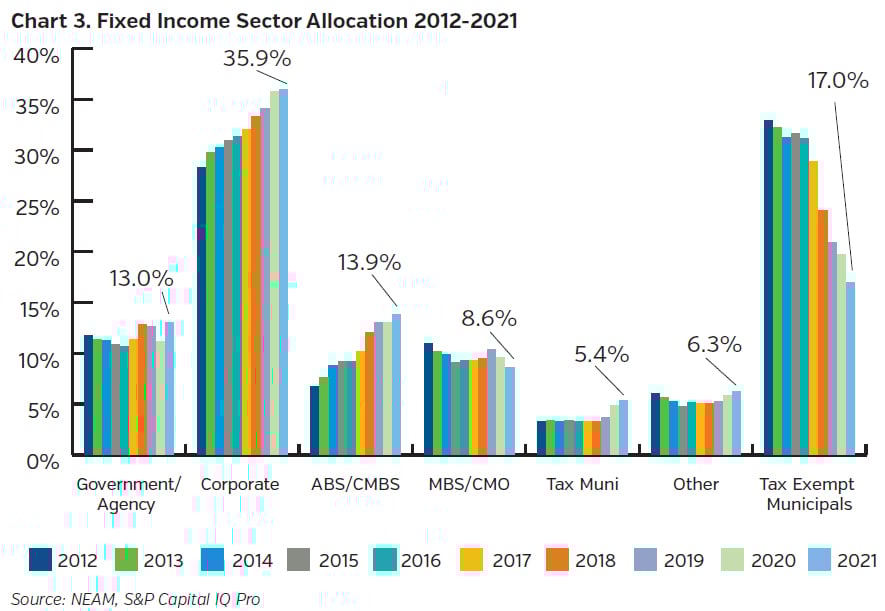
Chart 3 displays secular trends in fixed income sector allocations over the past decade. Corporate and tax-exempt municipal bonds represent the largest two sectors. Corporate allocations continued to grow and accounted for more than one-third of the industry’s fixed income holdings at year-end 2021. The tax-exempt municipal sector, on the other hand, exhibited steady decline, and reductions accelerated since the 2018 tax law changes. ABS and CMBS allocations have continued to rise and partially offset the reduced allocation from the tax-exempt municipal sector. Taxable municipal allocations exhibited steady increases for the last three years.
Book Yield Continued Trending Downward
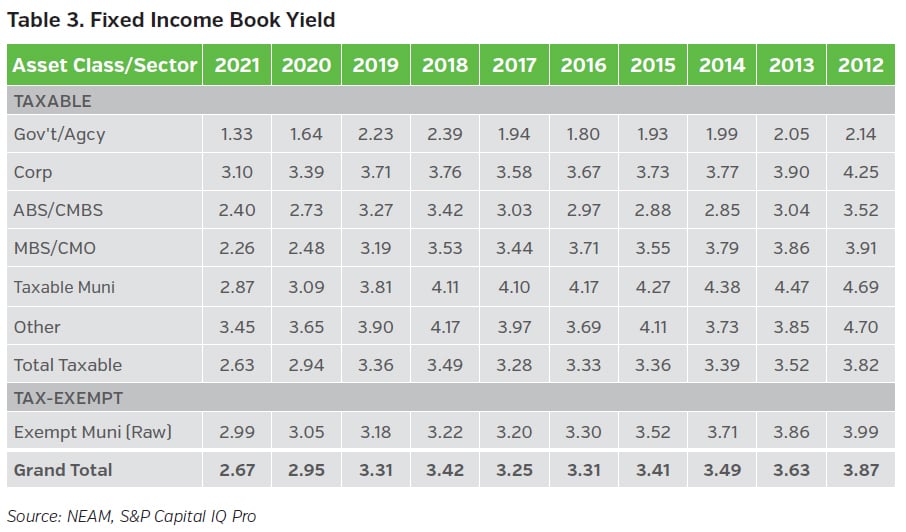
The industry’s book yield declined 120bps over the past 10 years (see Table 3). After a slight and temporary uptick in 2018, the industry’s book yield continued its downward trend. In 2021, the overall book yield experienced a decline of 28 bps over the prior year, while ABS and CMBS showed the most reduction at 33 bps.
Duration Relatively Unchanged
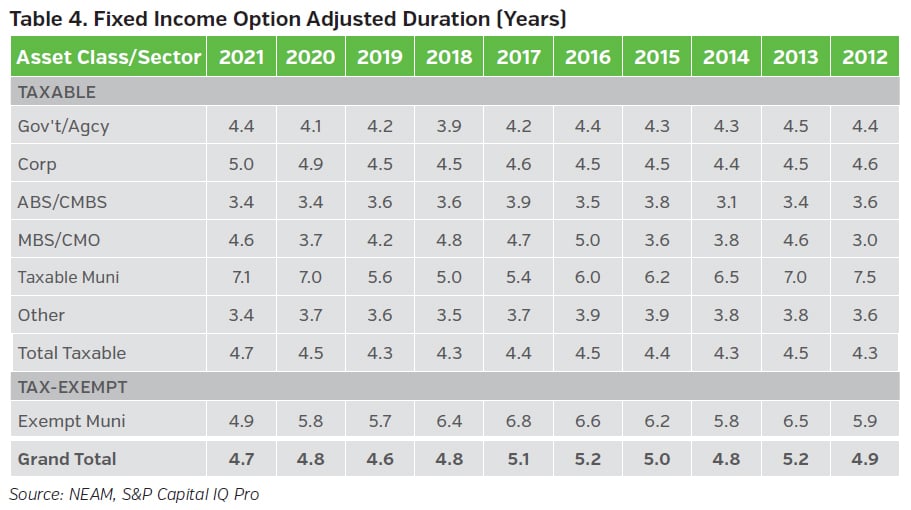
Table 4 displays option-adjusted duration (OAD) by fixed income sector. The OAD statistics are based upon CUSIP level holdings extracted from Schedule D statutory filings and exclude any bonds held at the holding company level, derivatives, and private placement securities. The industry’s aggregate OAD has remained relatively unchanged since 2018. In 2021, the aggregate OAD shortened slightly, driven by meaningful duration shortening observed in the tax-exempt municipal sector. Taxable bonds, on the other hand, exhibited consistent duration extension across most sectors, except for MBS and CMO.
Below-Investment-Grade Allocation Expanded
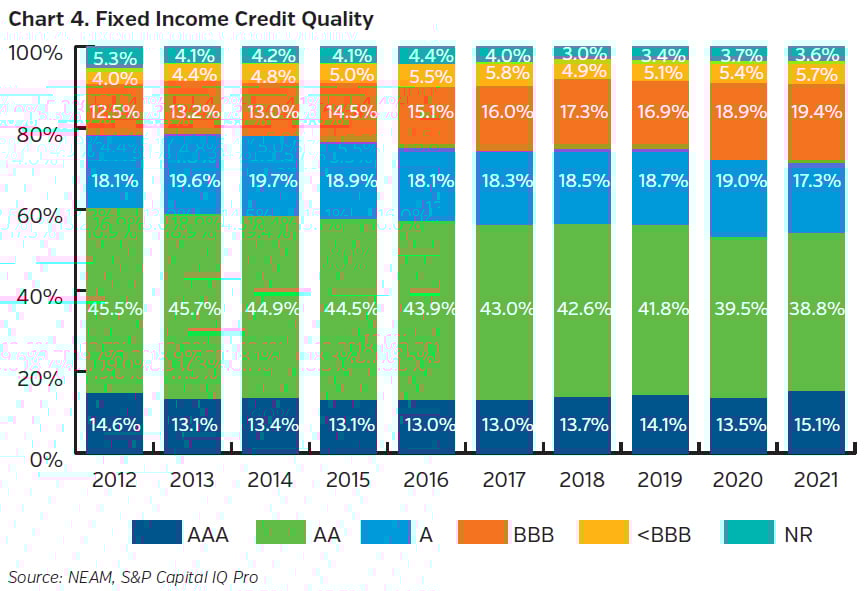
Chart 4 displays trends in fixed income credit quality. Over the past decade, the allocation to AAA, AA, and A securities (NAIC 1 category) has trended downward, while BBB and high yield (<BBB) categories continued to increase and reached their highest allocations at year-end 2021. Over the similar time-period, while the portion of BBB-rated bonds within the U.S. investment grade corporate bond market climbed from 40% to 50%, the observed industry’s allocation to BBB-rated bonds increased by 55% from 12.5% to 19.4%. A slight increase in AAA-rated securities is noted, rising from 14.6% to 15.1% over the 10-year period.
Key Takeaways
- Faced with the pandemic uncertainty, inflationary pressure, and business uncertainties, the U.S. P&C insurance industry strengthened its liquidity by holding additional cash and short-term holdings.
- Risk asset allocations continued to rise; reached a new high in 2021 and remained dominated by equity.
- The industry has experienced declining investment returns, with contribution from tax-exempt bonds representing less than half of the level observed a decade ago.
- Within the fixed income portfolio, the tax-exempt municipal allocation has been steadily declining and replaced by increased allocations in corporate, ABS, and CMBS. The industry’s book yield has declined by 120bps over the past decade, while below-investment-grade allocation expanded, however, duration has remained within range.
- Under the rising rate environment, we believe insurers should adopt a holistic enterprise framework to assess their asset risk budget and help ensure they are adequately compensated for risks taken.
Please contact us if you would like to receive a customized enterprise comparative assessment, which facilitates in-depth comparisons and contrasts of asset and liability characteristics of your company relative to peer organizations. The assessment supports decisions with enterprise risk preferences and investment strategies.


