
Executive Summary
The U.S. P&C insurance industry strengthened its liquidity as companies navigated underwriting uncertainties amid the global pandemic crisis in 2020. Bolstered liquidity and low reinvestment yield led the industry to experience the largest annual decline of book yield in the past 10 years.
Over the last decade, the industry’s risk asset allocations increased by more than 25% and BBB-rated fixed income exposure almost doubled. Despite this, overall net investment income experienced an 89 bps reduction, with book yield now 125 bps lower than it was 10 years ago.
Under this low rate and tight spread environment, investment return enhancement opportunities are limited without additional risk taking. We believe an insurer’s asset risk taking (and return seeking) needs to be evaluated within a holistic framework where enterprise objectives, underwriting characteristics, and business profiles are incorporated.
Declining Investment Income Weighs on Return on Equity (ROE)
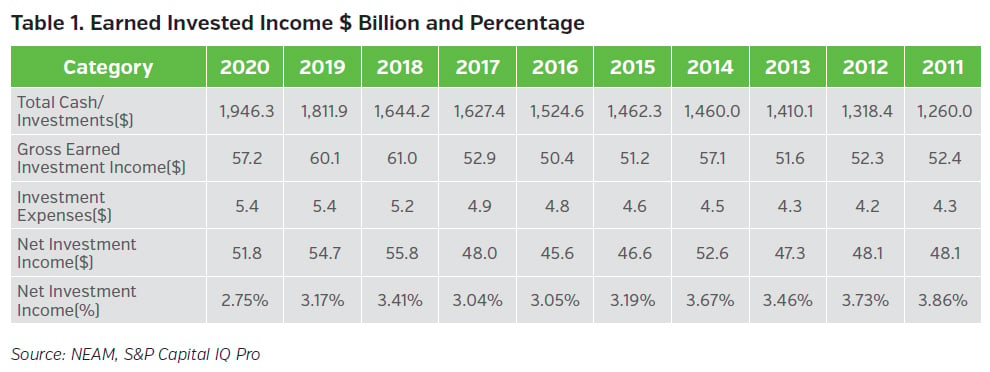
Table 1 highlights the industry’s earned investment income on a gross and net basis. Net investment income as a percentage of total cash and investments declined from 3.86% to 2.75% over the last decade. In 2020, net Investment income ($) declined by $3bn and net investment income (%) fell by 42 basis points (bps), compared to 2019. We estimate that a reduction of 42 bps in return on assets would translate into a 90 bps decline in ROE for the P&C insurance industry, based on the industry’s investment leverage of 2.15.
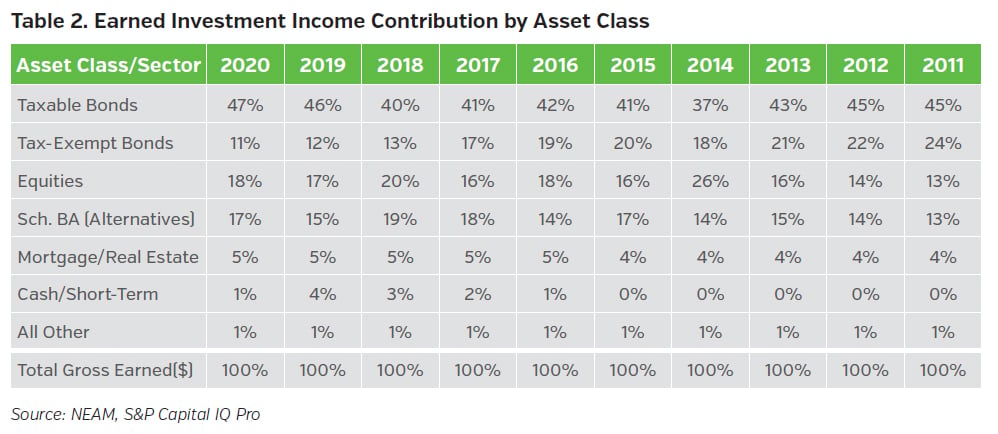
We further examine the industry’s earned investment income contribution from major asset classes (Table 2). The contribution to net investment income from tax-exempt bonds decreased from 24% in 2011 to 11% in 2020. This reduction reflected both a lower remaining embedded book yield level, as higher yielding assets mature, and a reduction in holdings, due to diminished tax advantages from changes made to the tax laws in 2017.
Liquidity Strengthened Amid the Pandemic Uncertainty
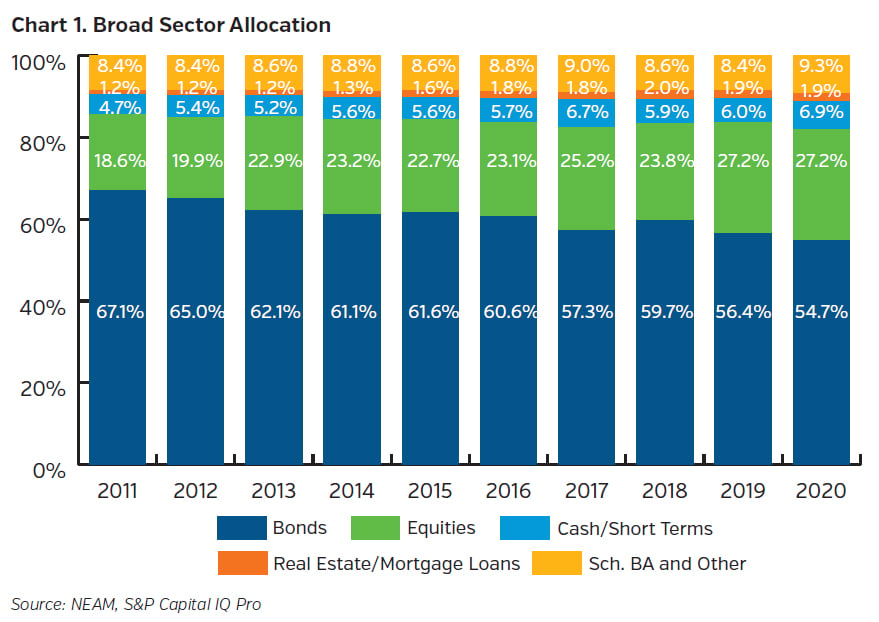
Chart 1 shows the industry’s statutory asset allocation across broad sectors over the last decade. Faced with the pandemic crisis and business uncertainties in 2020, the industry enhanced its liquidity through additional cash and short-term holdings. Bonds represented more than half of the total invested assets, although the allocation continued to decline year over year. The industry’s growing equity allocation has been largely driven by stock market appreciation, and less by deliberate allocation to the sector. The allocation to Schedule BA assets reached the highest level in 2020 while it remained concentrated among large organizations.
Risk Asset Allocation Reached a New High
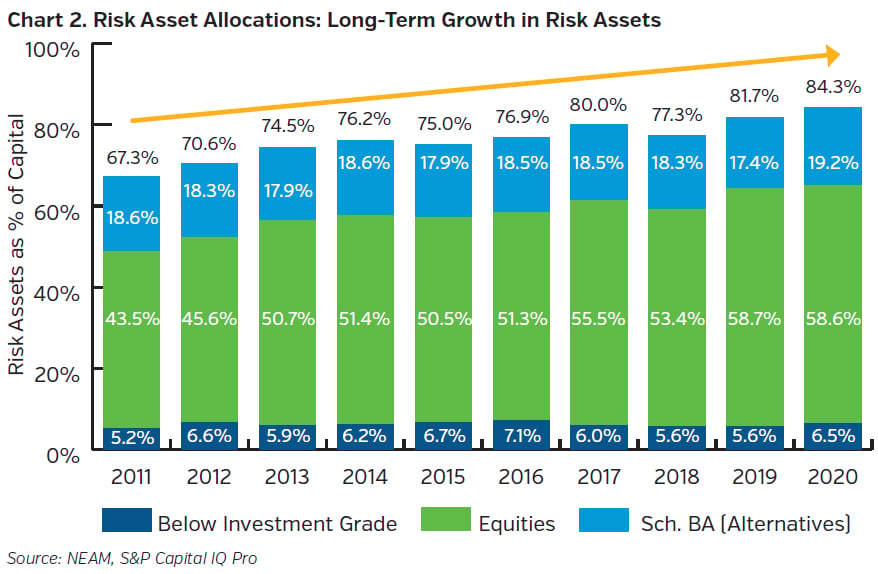
The industry’s allocation to risk assets continued to rise and reached a new high (84.3% of surplus or 39.2% of invested assets) at year-end 2020 (Chart 2). Equities remained the majority while Schedule BA allocation rose meaningfully in 2020. The data suggests an implied barbell risk-taking approach where high quality, liquid and short duration investment grade fixed income portfolio allocations are combined with a risk asset allocation dominated by equities.
Fixed Income Portfolio Details
Chart 3 displays secular trends in fixed income sector allocations over the past decade. Corporate and tax-exempt municipal bonds represent the largest two sectors. Corporate allocation continued to grow and accounted for more than one-third of the industry’s fixed income holdings at year-end 2020. The tax-exempt municipal sector, on the other hand, exhibited steady decline, and reductions accelerated since the 2018 tax law changes. ABS and CMBS allocations have continued to rise and partially offset the reduced allocation from the tax-exempt muni sector. Taxable municipal allocation exhibited a meaningful increase to 4.8% at year-end 2020.
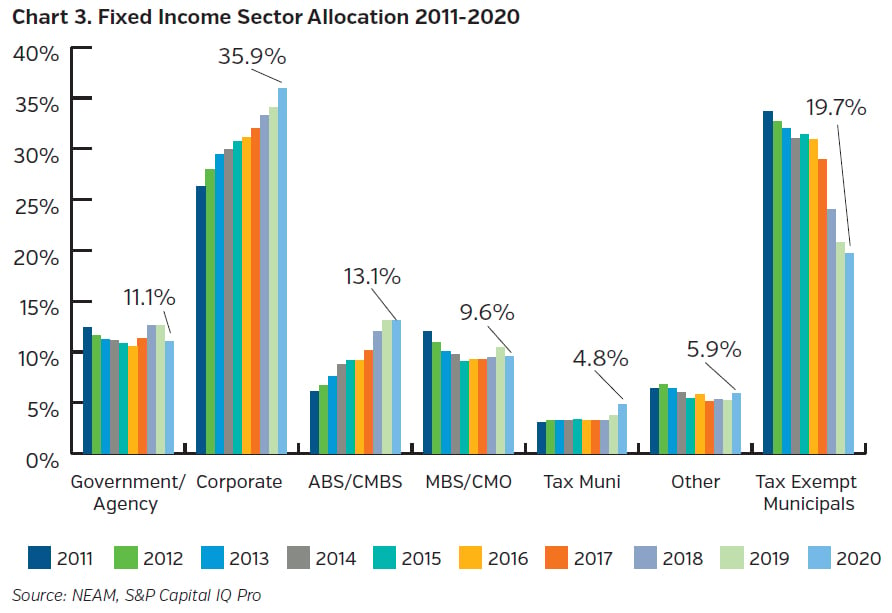
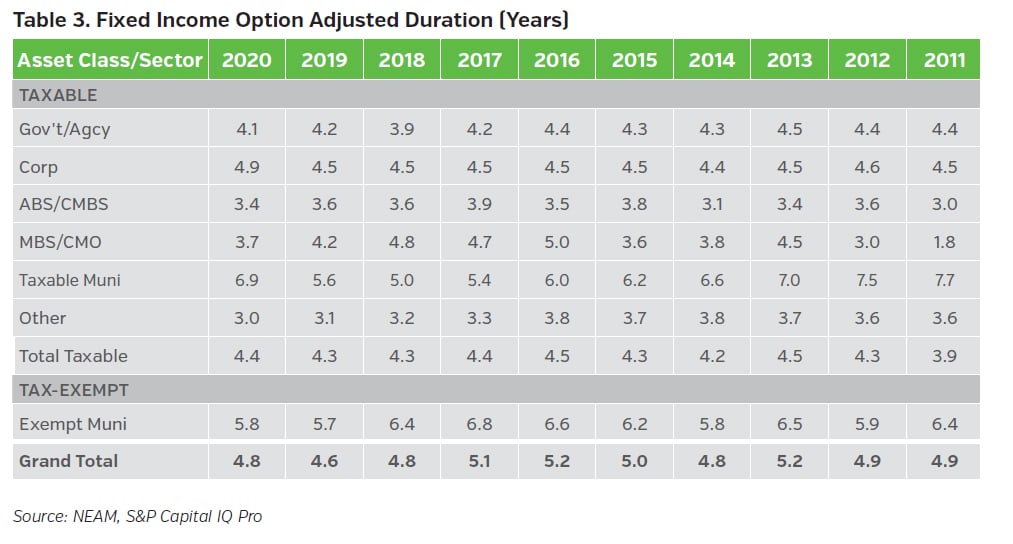
Table 3 displays option-adjusted duration (OAD) by fixed income sector. The OAD statistics are based upon CUSIP level holdings extracted from Schedule D statutory filings and exclude any bonds held at the holding company level, derivatives, and private placement securities.
The industry’s aggregate OAD remained largely unchanged since 2018 driven by a combination of: 1) diminishing tax-exempt municipal allocation, which tends to exhibit a longer duration, and 2) duration extensions seen in broad corporate bond indices, driven by lower rates resulting from central banks’ actions to cope with the pandemic crisis.
The industry’s book yield declined 125 bps over the past 10 years (see Table 4). After a slight and temporary uptick in 2018, the industry’s book yield continued its downward trend. In 2020, the overall book yield experienced the largest year-over-year decline of 35 bps in the last decade, with taxable municipals showing the most reduction at 73 bps.
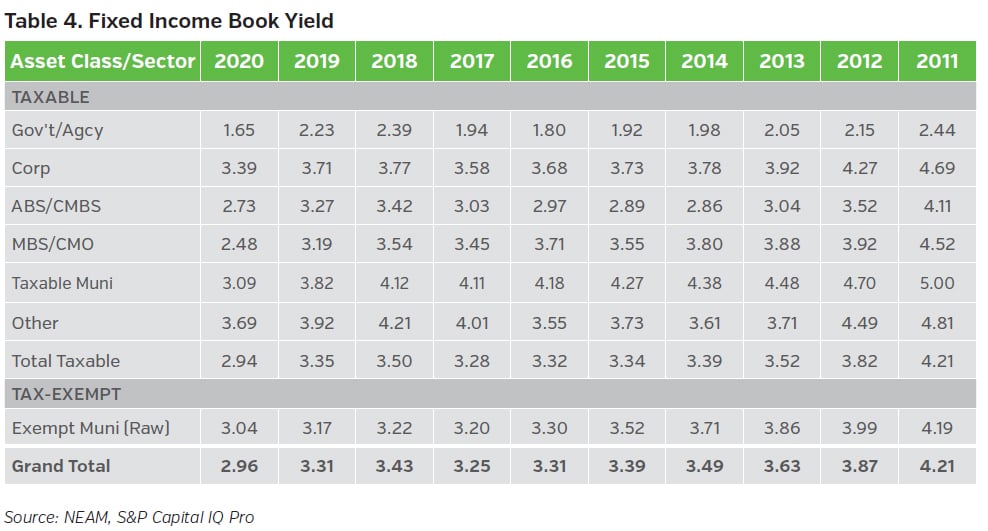
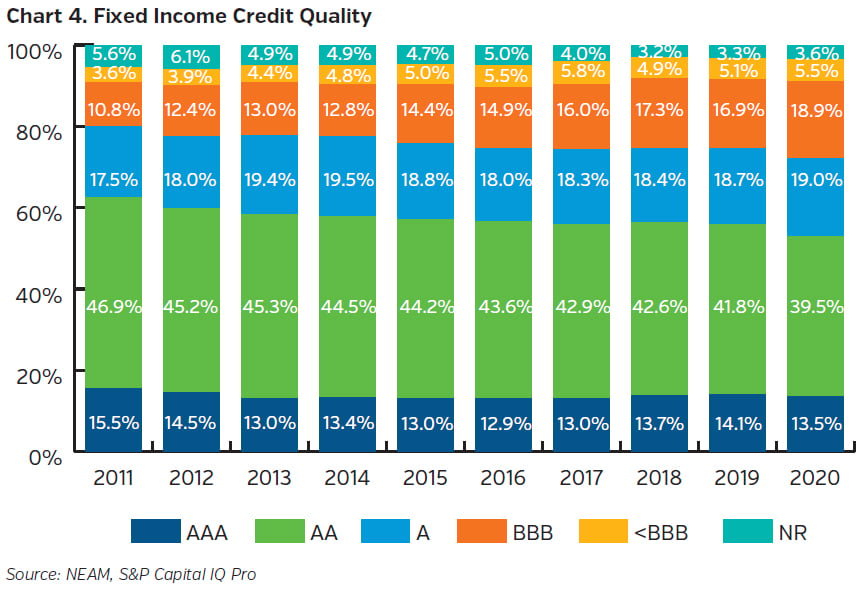
Chart 4 displays trends in fixed income credit quality where meaningful movements were observed in 2020. The BBB allocation increased by 2%, offset by a similar reduction in the AA allocation. Over the past decade, the allocation to AAA, AA, and A securities (NAIC 1 category) continued to trend downward, while BBB and high yield (<BBB) categories continued to increase and reached their highest allocations at year-end 2020. Over the similar time-period, while the portion of BBB-rated bonds within the U.S. corporate bond market climbed from 40% to 51%, the observed industry’s allocation to BBB-rated bonds almost doubled.
Limited Return Enhancements under the Low-Rate and Tight-Spread Environment
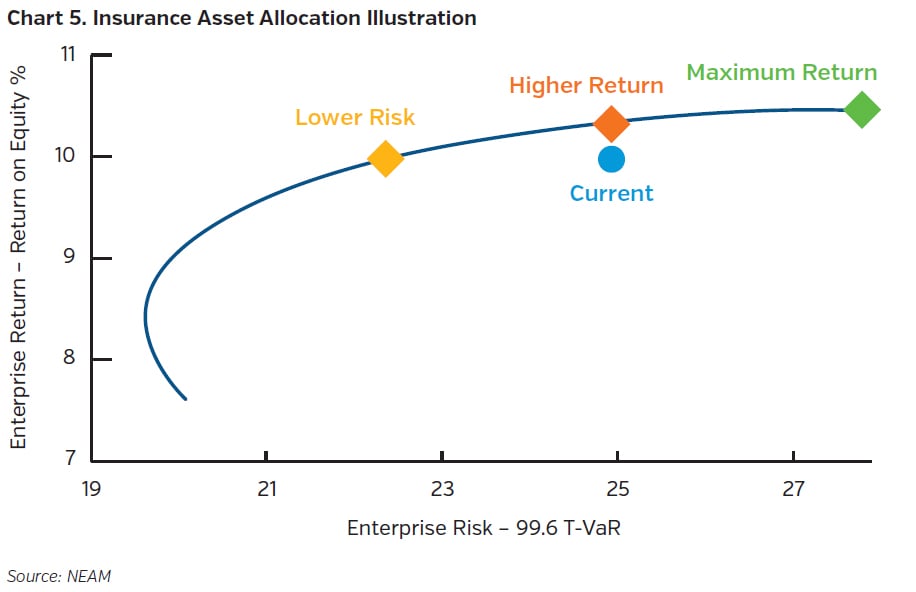
The global pandemic and central banks’ actions have resulted in a challenging low-rate environment for the industry. Valuations are rich across most, if not all, asset classes and sectors. Recent asset allocation studies for our clients indicate that there are very limited potential return enhancement opportunities unless the company is willing (and able) to assume additional risk. Chart 5 is a sample illustration where at the current level of risk (horizontal axis), the potential return pickup (vertical axis) is limited. Insurers should utilize a holistic enterprise framework when considering taking additional asset risk in pursuit of investment returns.
Key Takeaways
- Faced with the global pandemic uncertainty, the U.S. P&C insurance industry strengthened its liquidity through increased cash and short-term holdings.
- The industry has experienced declining investment returns, while risk asset allocations continued to rise and reached a new high in 2020.
- Within the fixed income portfolio, the tax-exempt municipal allocation has been steadily declining and replaced by increased allocations in corporate, taxable municipal, ABS, and CMBS. The industry’s book yield has declined by 125 bps over the past decade, while duration has remained within range.
- The pandemic and central banks’ actions have resulted in a challenging low-rate environment for the insurance industry. Insurers should adopt a holistic enterprise framework to assess their asset risk budget and help ensure they are adequately compensated for risks taken.
Please contact us if you would like to receive a customized enterprise comparative assessment, which facilitates in-depth comparisons and contrasts of asset and liability characteristics of your company relative to peer organizations. The assessment supports decisions with enterprise risk preferences and investment strategies.


