
EXECUTIVE SUMMARY
The U.S. P&C insurance industry continued to experience declines in investment returns. The recent pandemic crisis and Central Bank actions have created an even more demanding environment for P&C insurers to navigate underwriting uncertainties and investing challenges.
Over the last decade, the industry’s risk asset allocations increased by more than 50% and BBB-rated fixed income rating exposure almost doubled. Despite this, overall net investment income experienced a 58 bps reduction, with book yield now 100 bps lower than it was 10 years ago.
We believe an insurer’s asset risk taking (or risk budget) needs to be evaluated within a holistic framework where enterprise objectives, underwriting characteristics, and business profiles are incorporated to identify potential risk-adjusted return enhancement opportunities.
DECLINING INVESTMENT INCOME AND ITS IMPACT ON RETURN ON EQUITY (ROE)
Table 1 highlights the industry’s earned investment income on a gross and net basis. Net investment income as a percentage of total cash and investments declined from 3.73% to 3.15% over the last decade. In 2019, net Investment income ($) declined by U.S. $0.7 billion and net investment income (%) reduced by 21 basis points (bps), compared to 2018. We estimate that a reduction of 21 bps in return on assets would translate into a 46 bps decline in RoE for the P&C insurance industry, based on the industry’s investment leverage of 2.16x. Given that reinvestment yields have declined by over 100 bps since year-end, this RoE pressure has only intensified thus far in 2020.
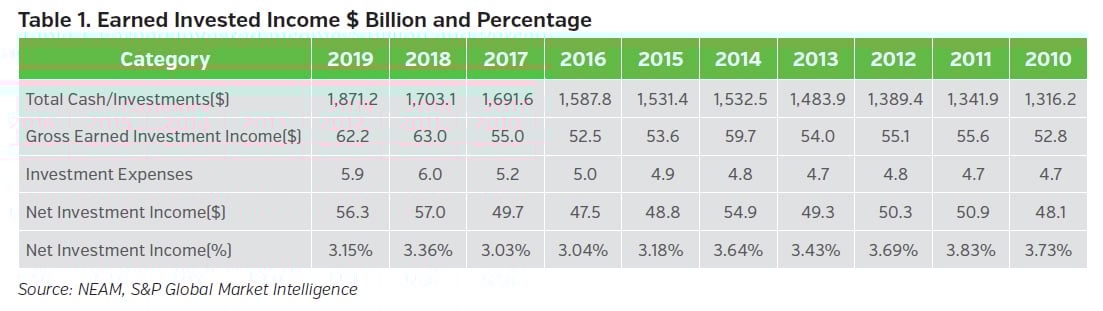
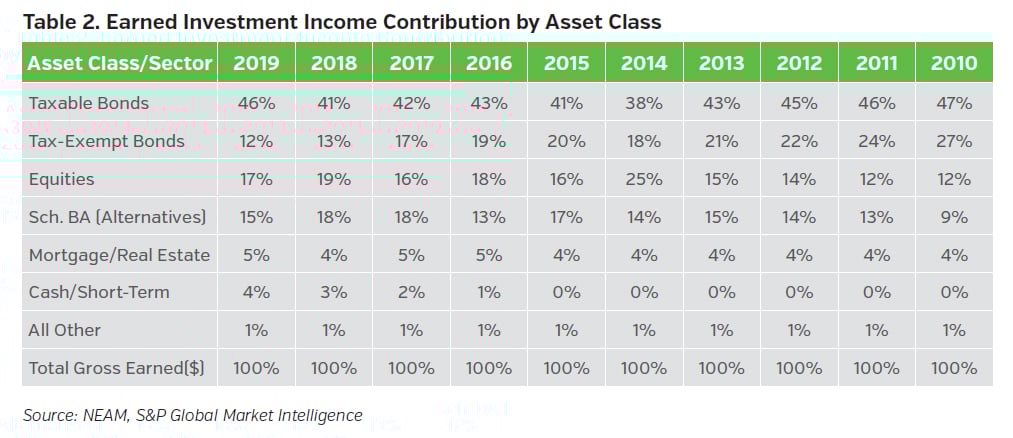
Now let’s further examine the industry’s net investment income contribution from major asset classes (Table 2). The contribution to net investment income from tax-exempt bonds decreased from a high of 27% in 2010 to 12% in 2019. This reduction reflected both a lower remaining embedded book yield level, as higher yielding assets mature, and a reduction in holdings, due to reduced tax advantages from changes to the 2018 tax laws.
Increasing Risk Asset Allocations
Chart 1 shows the industry’s statutory asset allocation across broad sectors over the last decade. The most notable changes in allocation were the continued increase in equities. The industry’s growing equity allocation has been largely driven by stock market appreciation, and less by deliberate reallocation to the sector. While overall invested assets for the industry grew from US $1,316 billion in 2010 to US $1,871 billion in 2019 (Table 1), the allocation to equities and bonds combined remained relatively unchanged over the decade. In addition, the allocation to Schedule BA assets remained stable and highly concentrated among large organizations.
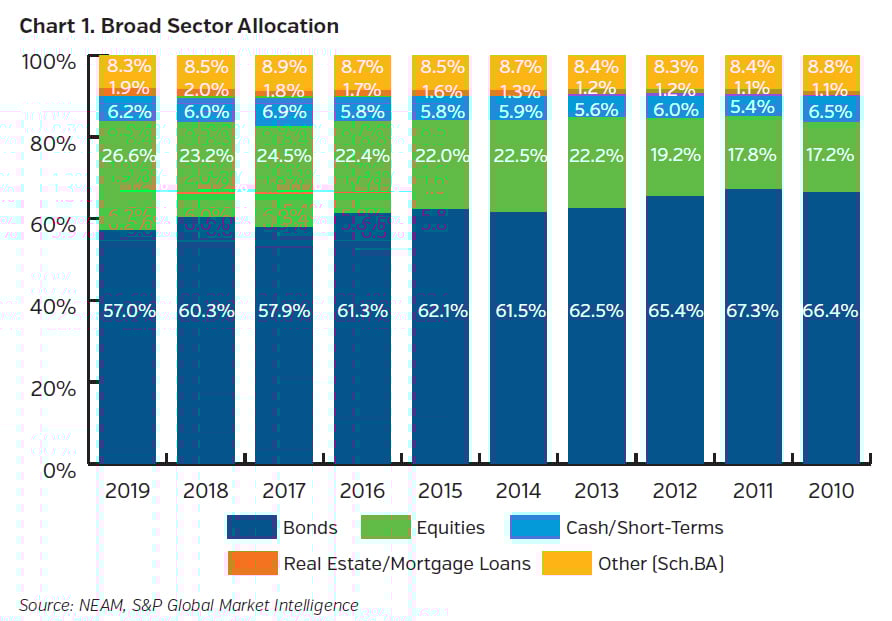
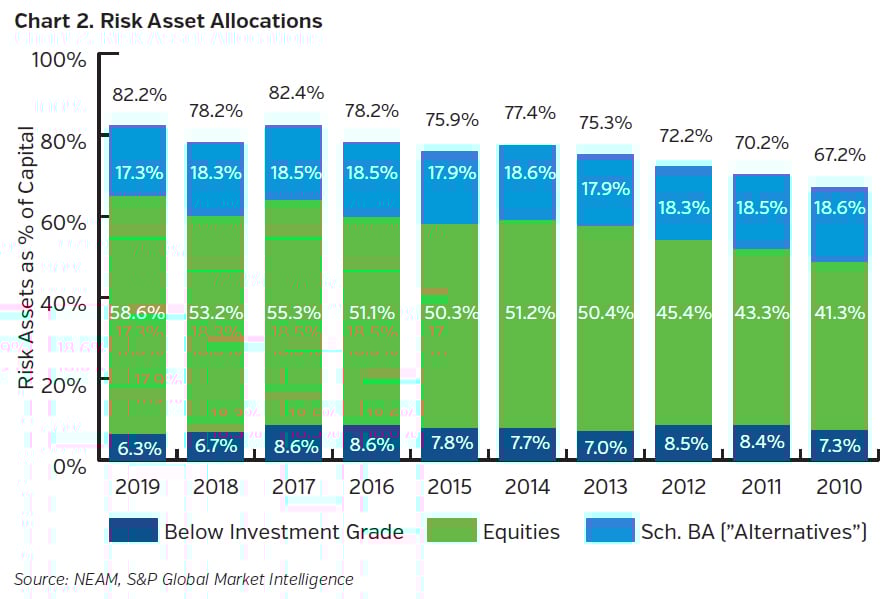
The industry’s allocation to risk assets continued to rise, with equities accounting for the majority. The data suggests an implied barbell risk-taking approach where high quality, liquid and short duration investment grade fixed income portfolio allocations were combined with a risk asset allocation dominated by equities.
Fixed Income Portfolio Details
Chart 3 displays secular trends in fixed income sector allocations over the past decade. The corporate and tax-exempt municipal sectors together account for the majority of the industry’s fixed income allocation. The tax-exempt municipal allocation continued to decline, and reductions accelerated since the 2018 tax law changes.
The corporate sector accounted for one-third of the fixed income portfolio at year-end 2019, having continued its steady upward trend over the past 10 years. ABS and agency CMBS allocations have continued to rise and partially offset the reduced allocation from the tax-exempt muni sector. The “Other” sector reflects primarily taxable municipals and private placements, and has remained slightly below 10%.
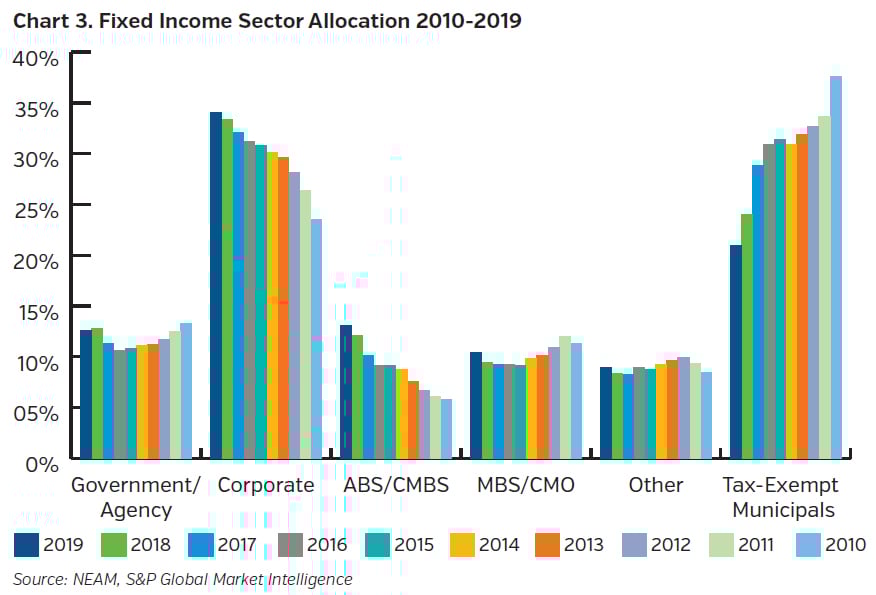
Table 3 displays option-adjusted duration (OAD) by fixed income sector. The OAD statistics are based upon CUSIP level holdings extracted from Schedule D statutory filings and exclude any bonds held at the holding company level, derivatives and private placement securities. The industry’s aggregate OAD shortened by 0.5 years over the last two years, driven by legacy long-dated tax-exempt municipals rolling off the portfolio.
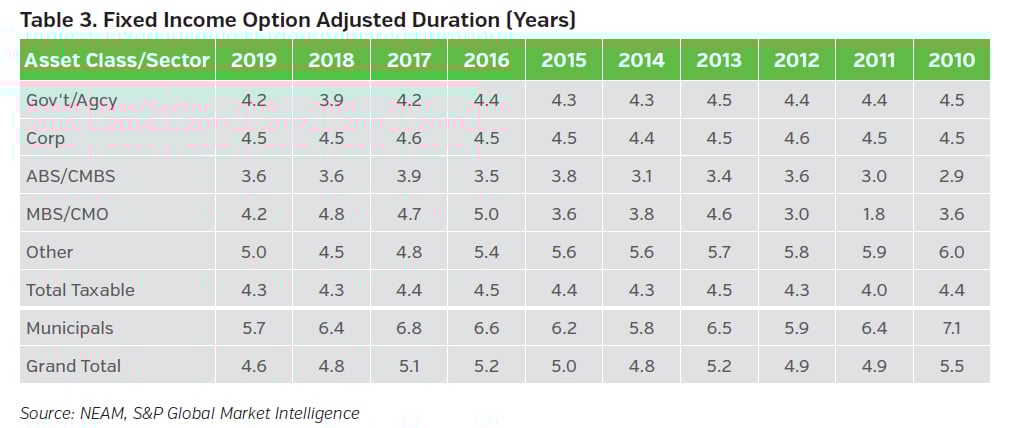
Table 4 displays book yields by fixed income sector. After a slight uptick in 2018, the industry’s book yield continued its downward trend, declining 11 bps during 2019 (from 3.43% to 3.32%). Book yields across all sectors declined in 2019, with the MBS/CMO sector showing the greatest decline of 34 bps (from 3.53% to 3.19%). Overall, the industry’s book yield declined by 100 bps over the 10-year period.
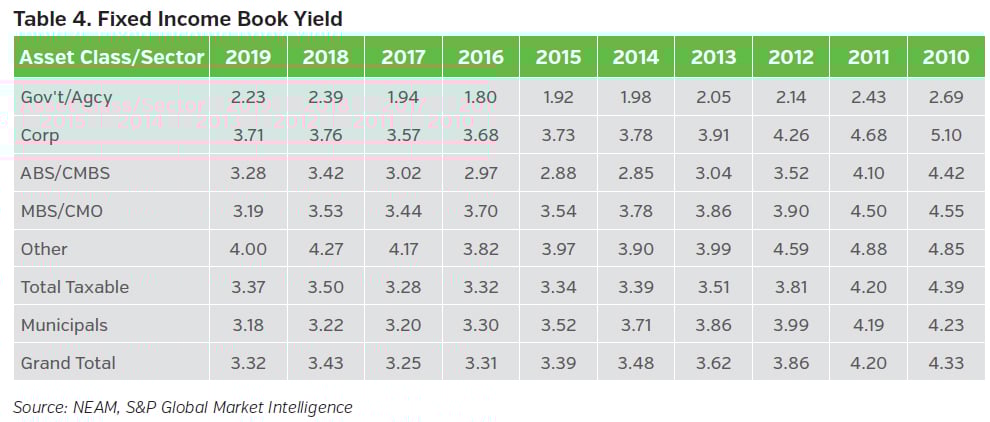
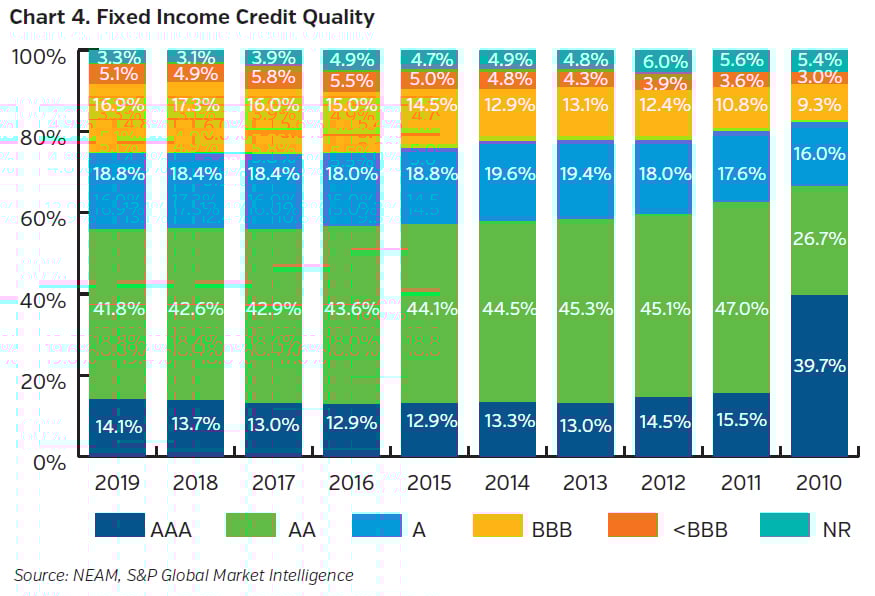
Chart 4 displays trends in fixed income credit quality. The credit quality distribution exhibited little movement in 2019. The allocation to AAA, AA and A securities (NAIC 1 category) remained at 75% of the overall portfolio, trending slightly downward for the last four years. The BBB category continued to trend upward marginally and now represents 17% of the overall fixed income portfolio. The high yield (<BBB) allocation increased from 3% in 2010 to 5% in 2018 and 2019. As highlighted in a prior General ReView, the 2011 reduction in AAA allocation was caused by Standards & Poor’s downgrade of U.S. government securities.
Are Risk-adjusted Returns Sufficient?
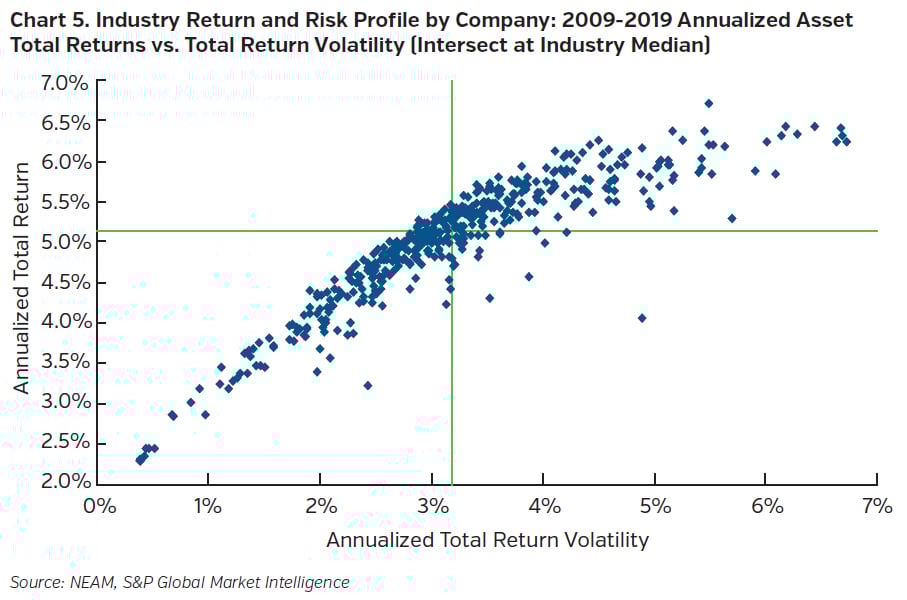
Chart 5 shows the historical average investment return and risk for each of the companies in the P&C industry as of year-end 2019. This marked-to-market total return framework allows for the comparison of portfolio “efficiency” for each company across the industry. The horizontal and vertical green lines represent the industry’s medians of return and risk, respectively. Among the four quadrants, the upper left quadrant is preferred (i.e., high return with low risk), while the lower right quadrant is least desirable (i.e., low return with high risk). Depending on the insurer’s own risk appetite and tolerance, its asset risk taking might differ but will be challenged in a lower-for-longer interest rate environment. However, regardless of the insurer’s specific “asset risk budget,” it should ensure it gets compensated for risks taken. Chart 5 indicates opportunities for potential improvement.
Key Takeaways
- The U.S. P&C insurance industry has experienced declining investment returns, while risk asset allocations, particularly equities, continued to rise.
- Within the fixed income portfolio, the tax-exempt municipal allocation has been steadily declining and replaced by increased corporate, ABS and CMBS allocations. The industry’s book yield has declined by 100 bps over the past decade, while duration has shortened as a result of a reduced allocation to tax-exempt municipals.
- The industry appears to follow a “barbell” risk-taking approach by holding a high credit quality, liquid fixed income portfolio along with risk assets comprised of volatile equities. A consistent marked-to-market framework that incorporates fixed income and risk assets can facilitate risk-adjusted return benchmarking among companies.
- The current pandemic situation and Central Banks’ actions have resulted in a challenging low rate environment for the insurance industry. Insurers need to adopt a holistic enterprise framework to understand and determine their asset risk budget and ensure they are adequately compensated for risks taken.
Please contact us if you would like to receive a customized enterprise comparative assessment, which facilitates in-depth comparisons and contrasts of asset and liability characteristics of your company relative to peer organizations. The assessment supports decisions with enterprise risk preferences and investment strategies.


