
Executive Summary
The U.S. life insurance industry broad sector allocations remained stable, with bonds and mortgage loans combined representing 85% of the allocation. Allocations to alternative (Schedule BA) assets reached a new high in 2019, but are predominately owned by large organizations.
Fixed income durations stayed relatively unchanged over the last five years, likely driven by asset liability matching requirements. Over the last decade, fixed income credit quality gradually declined, while industry book yield decreased by 115 basis points (bps). The recent pandemic crisis and central bank actions have created an even more challenging lower-for-longer interest rate environment for the life insurance industry.
Broad Sector Allocations Largely Unchanged
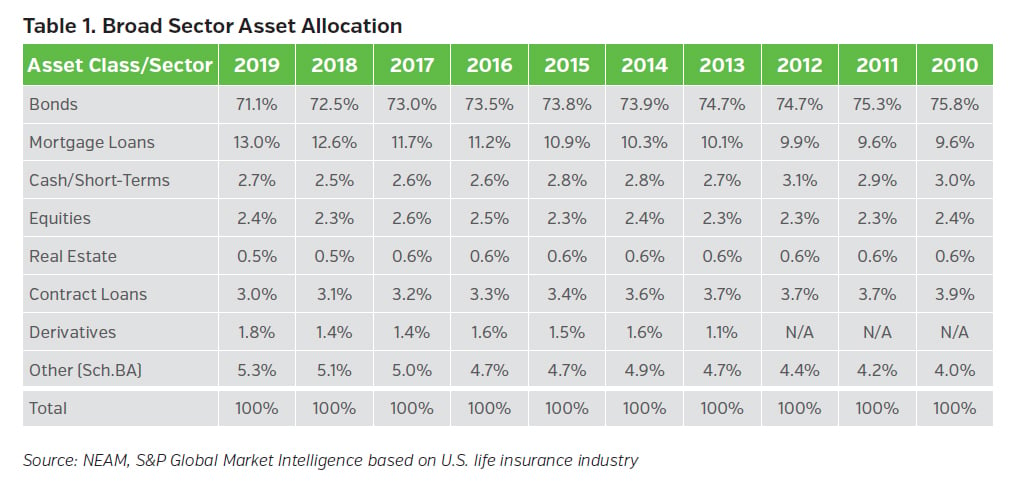
The U.S. life insurance industry’s statutory asset allocation across broad sectors remained mostly unchanged during 2019 (see Table 1). Bonds and mortgage loan sectors accounted for nearly 85% of the overall assets, as they continued to support the underlying long-dated liability obligations. The decreased allocation in bonds has been offset by the steadily increased allocation in mortgage loans. The allocation to Schedule BA assets reached a new high of 5.3% in 2019 and remained highly concentrated among large organizations.
Declining Net Investment Income
Table 2 highlights the industry’s earned investment income on a gross and net basis. Over the last decade, the total cash and investments grew 36% from $3.2 trillion to $4.3 trillion, while the net investment income ($) only increased by 14% from $164.0 billion to $186.6 billion. In 2019, the overall level of net investment income ($) declined by $0.8 billion and net investment income (%) fell by 16 bps, compared to year 2018. Given that reinvestment yields have declined by over 100 bps since year-end, this declining investment income pressure has only intensified thus far in 2020.
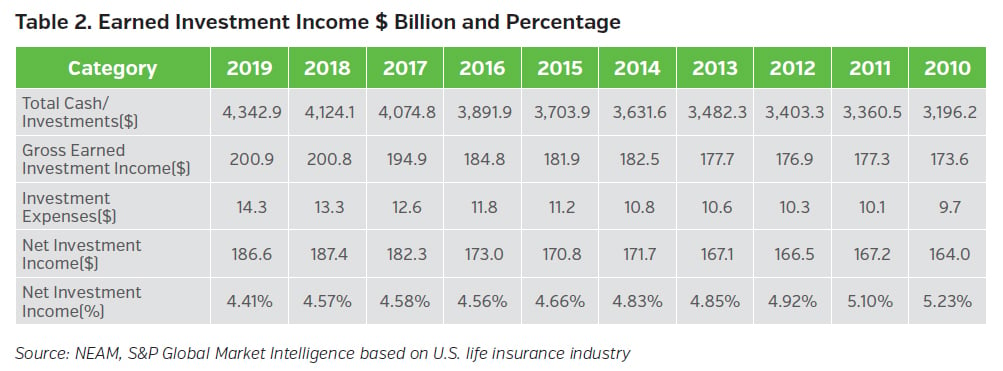
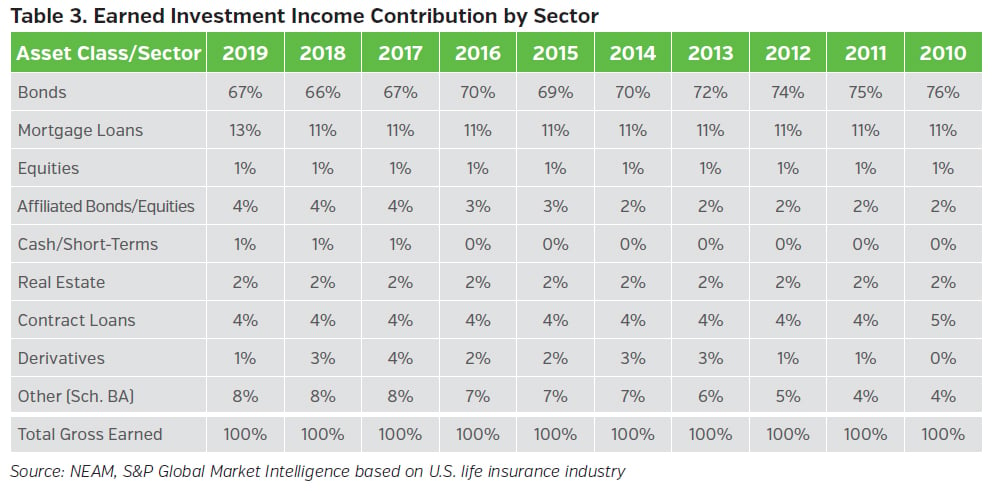
Table 3 displays the industry’s earned investment income contribution from broad sectors. Bonds and mortgage loans combined contributed 80% of the total, while the contribution from unaffiliated equities represented only 1%. The contribution from Schedule BA assets, which ranked behind bonds and mortgage loans, has doubled from 4% to 8% over the last decade.
Fixed Income Portfolio Details
The corporate sector represents nearly half of the aggregate fixed income portfolio. Private placements is the second largest sector, and its allocation has continued to rise over the last three years. As noted in prior publications, unlike statutory Schedule D Part 1A reporting, our private placements category excludes any 144A securities that are publicly traded.
The allocation to structured securities (i.e., ABS, CMBS and RMBS) declined from a high of 30% prior to the financial crisis to approximately 20% in 2013 and has remained at that level ever since. Within the structured securities, ABS and agency CMBS sectors have continued to rise, while the other sectors have experienced declines.
The allocation to taxable municipal bonds rose from less than 1% in 2010 to nearly 4.5% in 2019. The increase in this allocation began in 2009 and 2010, after the passage of the “American Recovery and Reinvestment Act.” This Act led to the creation of “Build America Bonds,” which allowed municipalities and municipal authorities to raise debt, with the federal government providing a direct subsidy of the interest cost.
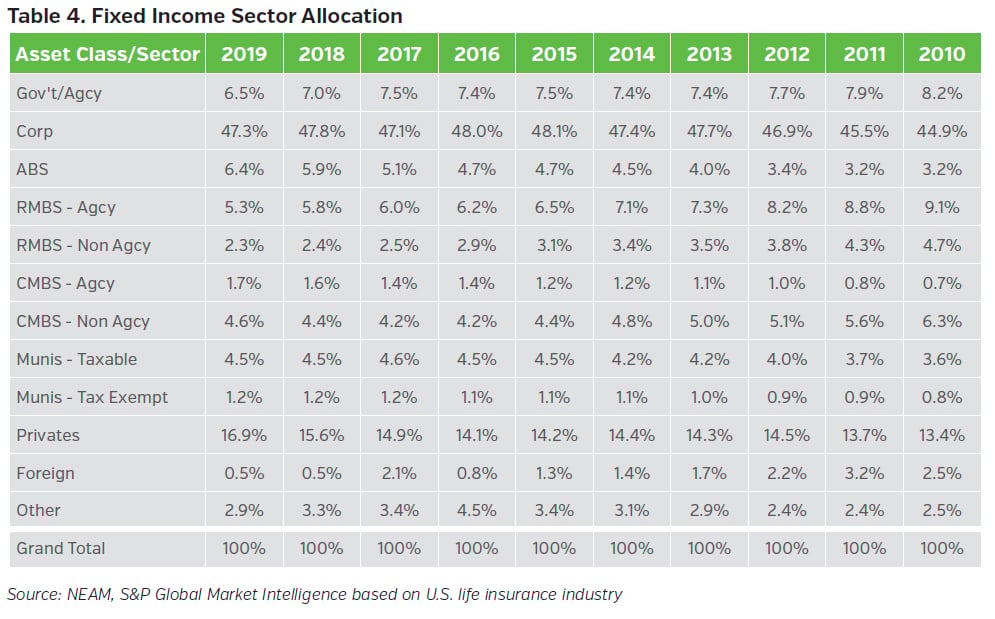
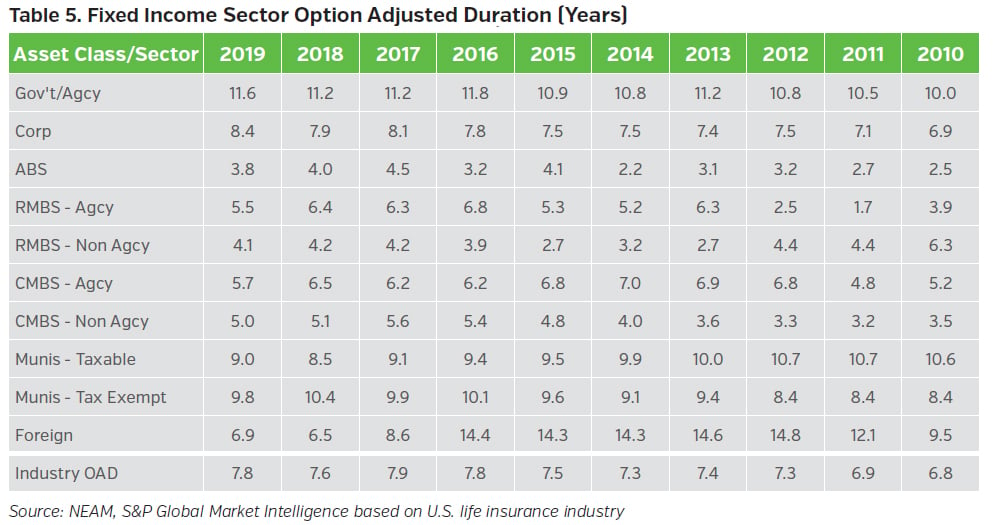
Table 5 displays option-adjusted duration (OAD) by fixed income sector. The OAD statistics are based upon CUSIP-level holdings extracted from Schedule D statutory filings and exclude any bonds held at the holding company level, derivatives, and private placement securities. The industry’s OAD was 5.5 years prior to the financial crisis in 2008 and then extended to 7.4 years through 2013. The duration lengthening through 2013 coincided with a material reduction of structured securities (see Table 4), which tend to exhibit shorter durations. The industry’s OAD extended an additional 0.4 years from 2013 to 2016 and has remained relatively unchanged since, likely driven by asset liability matching requirements.
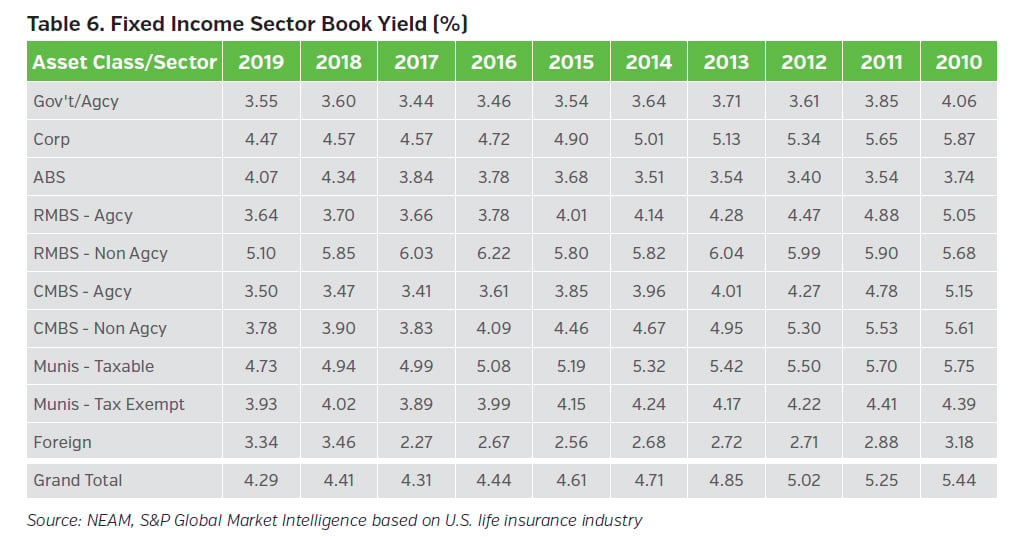
The overall industry’s book yield has declined by 115 bps over the last decade (see Table 6). Book yields across all sectors, except for Agency CMBS, declined in 2019. Cumulative 170 bps reductions in the book yields of Agency and Non-agency CMBS since 2010 reflect the runoff of seasoned pre-crisis exposures at higher book yields.
Over the last 10 years, the allocation to AAA, AA and A securities (NAIC 1 category) decreased from 53.7% to 47.9%, while the BBB category increased from 21.4% to 26.8%. The below investment grade (<BBB) allocation reached its lowest level in a decade during 2019.
The NA category consists of mostly “true”1 private placement securities, which accounted for 16.9% of total fixed income holdings in 2019 (see Table 4). Based on historical statutory filings, about half of the industry’s private placement securities fell into the BBB (NAIC 2) rating category. This is much higher than the BBB allocation seen in public fixed income securities (see Chart 1).
The reduction in AAA securities in 2011 was the result of Standards & Poor’s downgrade of U.S. government securities. The rotation between the proportion of AAA and AA seen in 2013 was due to migration of AAA to lower-rated securities.
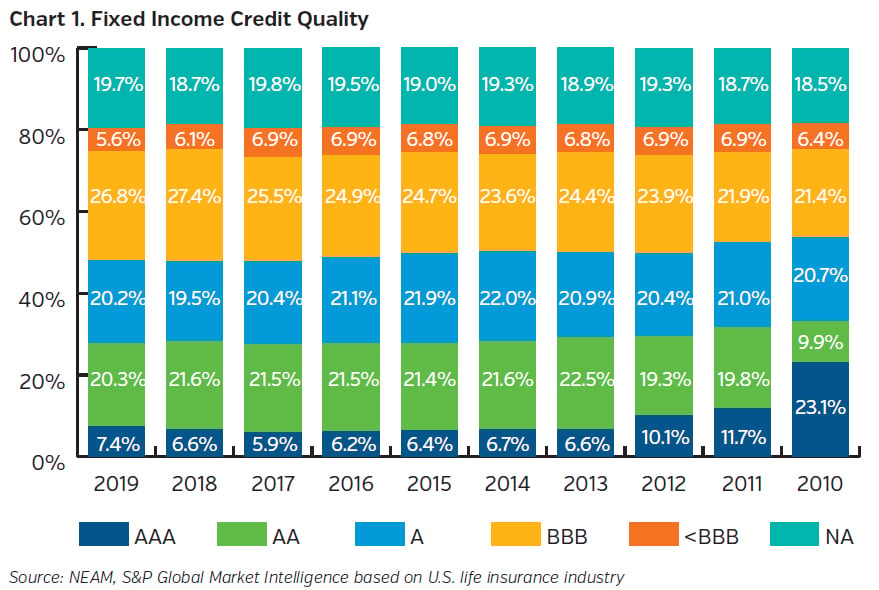
Table 7 displays the book yields for public fixed income securities by credit rating category. The slight uptick in book yields observed in 2018 was short lived. Total bond book yields declined across all rating categories, with an aggregated decline of 12 bps in 2019. The higher rating categories, AAA and AA, experienced the least reduction of 91 bps, while the BBB category experienced the most reduction of 144 bps from 2010 to 2019.
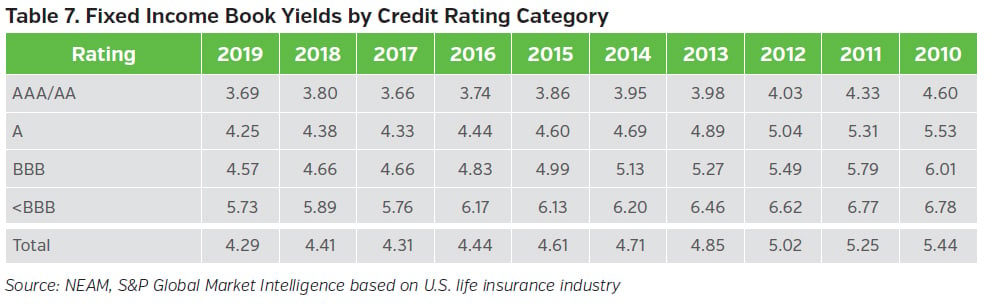
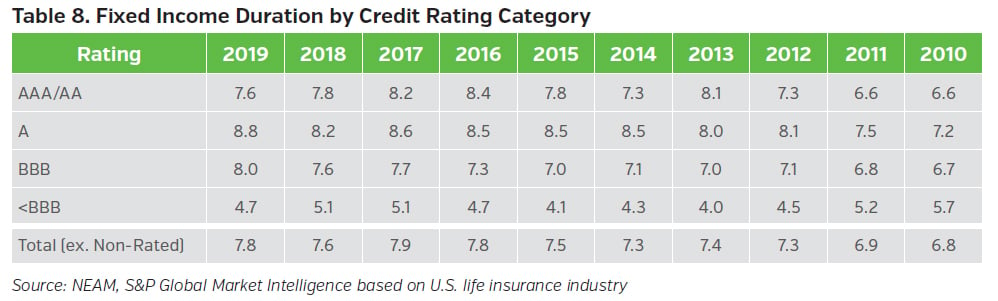
Table 8 displays the OAD for public fixed income securities by credit rating category. High yield (<BBB) bonds typically exhibit shorter durations than investment grade bonds. Over the last decade, the OADs extended across all rating categories, except for the <BBB category where OAD shortened by one year. Non-rated securities (primarily private placements), which accounted for 19.7% (see Chart 1) of total fixed income holdings in 2019, were not included in the aggregate OAD calculations.
Key Takeaways
- The industry’s slowly declining bond allocations have been replaced by mortgage loans. The allocation to Schedule BA assets reached a new high in 2019. However, these alternative assets contributed to only 8% of the industry’s investment income and remained highly concentrated among large organizations.
- Within the fixed income portfolio, allocations to private placement securities, ABS and taxable municipals continued to trend upward, while allocations to RMBS, government and agency bonds exhibited declines.
- Book yields continued to decline from 2010’s high of 5.44% to 4.29% in 2019. Asset duration remained relatively unchanged over the last five years and might have been driven by asset liability matching requirements.
- Although the industry’s high yield (<BBB) allocation reached a new low in 2019, the BBB allocation for public fixed income securities had risen steadily since 2010. Private placements, which represented 16.9% of the total fixed income holdings in 2019, comprise approximately 50% of BBB (NAIC 2) rated securities.
- The current pandemic situation, and central banks’ actions, have resulted in a challenging low rate environment for the life insurance industry. Insurers need to adopt a holistic enterprise framework to ensure they are adequately compensated for risks taken.
Please contact us if you would like to receive a customized comparative assessment, which facilitates in-depth comparisons and contrasts of asset and liability characteristics of your company relative to peer organizations. The assessment supports decisions with enterprise risk preferences and investment strategy.
Endnotes
1 “True” private placement category excludes any 144A securities that are publicly traded.


