
There are several key takeaways based on our review:
- Industry combined ratio increased to 100.7, 3.5 percentage
points higher than the prior three-year average, as premium rose 2.7% - Net investment declined 2.9% to $47.4 billion, as invested assets increased 3.7% to $1,587.4 billion
- Fixed income yields declined, while duration increased and credit quality lessened
- Below investment grade fixed income, equities and BA assets increased 2.1 percentage points to 77.6% of statutory capital and surplus
- Statutory capital rose 3.6% to $712.5 billion, reflecting net income and unrealized gains exceeding capital withdrawals
- In periods when underwriting and capital markets are evolving, we believe an Enterprise Based Asset Allocation™ is particularly necessary to manage enterprise risk and capital management needs
- Financial statement summary results and broad asset allocation trends for the past 10 years
- Portfolio details: highlights of fixed income risk metrics and yields
- A brief synopsis and preview of future topics
Table 1 provides a 12-year history of select metrics for the U.S. property-casualty insurance industry. Net income in 2016 declined nearly $14 billion, primarily due to a deterioration in underwriting profit. Return on average equity fell to 6.3%, or 1.8 percentage points below the 8.1% annualized after-tax total return since 2002. This is after accounting for capital withdrawals and contributions (not shown)1. Leverage ratios remain low2.
Underwriting and operating cash flow declined, reflecting both a deteriorating combined ratio and lower earned investment income that offset an increase in written premiums. Cash and invested assets, total reserves and affiliated assets increased. Nominal underwriting losses, declining investment yields and low leverage combined to generate single digit returns on equity: a possible, and not too promising, portent for the future. How these results distribute across companies and groups will be a future topic.
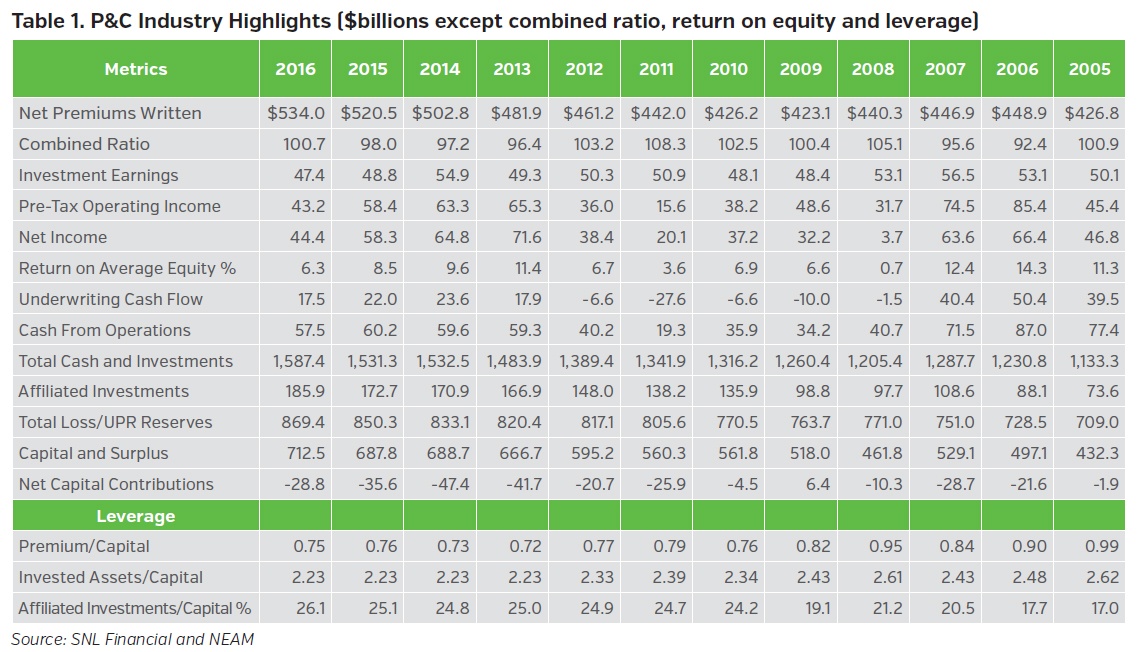
Chart 1 displays two key components of statutory investment results and the net of investment expense before tax net income. Gross earned investment income declined $1.4 billion, primarily due to a $2.3 billion reduction in Schedule BA income spread among a few insurers, and a $1.2 billion increase in affiliated common equity income which offset small declines in other income categories (both details not shown).
Net capital gains increased $50 billion, reversing the prior year’s $17 billion losses. Realized gains and reversals occurred primarily in unaffiliated equities ($40 billion), unaffiliated bonds and BA assets (approximately $4.5 billion each). Small net gains were also realized within both the taxable and tax-exempt bond portfolios, placing downward pressure on current and prospective book yields.
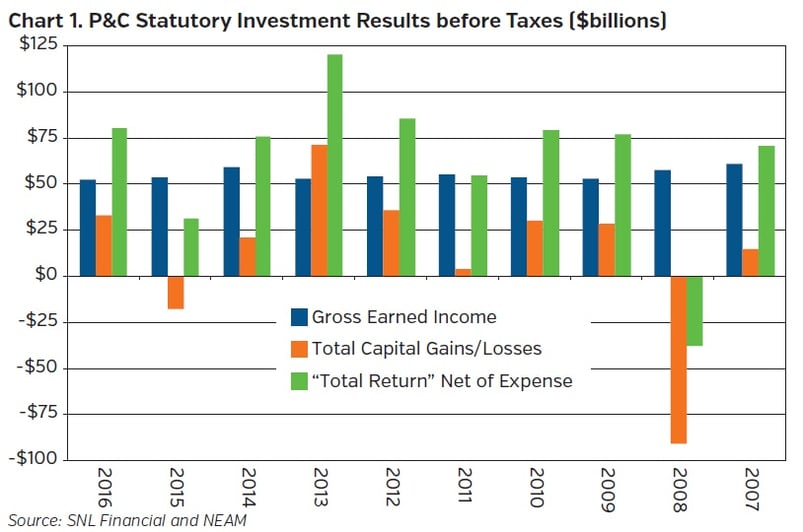
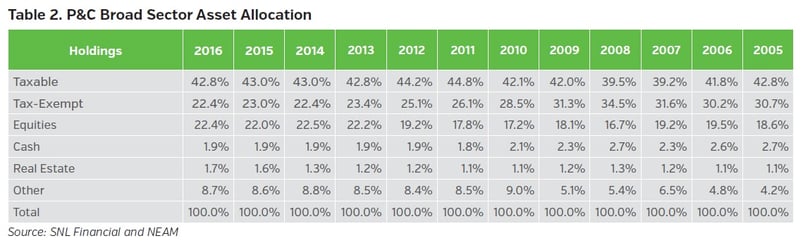
Table 2 shows the asset allocation across broad sectors. These allocations are essentially unchanged over the last four years. Throughout the 12-year period, major changes include declining tax-preferenced municipal allocations and increased equity (both affiliated and unaffiliated holdings) and Other (Schedule BA) asset (due principally to one organization) allocations.
Holdings of “risk” assets (common and preferred equities, Schedule BA assets and below investment grade fixed income securities) are summarized in Chart 2. As a percent of capital, 2013-2016 comparably large allocations remain below the 2001 peak value of 79%. And, whether the “risk” asset metric includes or excludes affiliated investments appears to have no impact on trends or ownership concentration.
The often heralded Schedule BA “alternative investments” as a panacea to the low-interest-rate environment remains greatly overstated: Berkshire Hathaway significantly impacts the industry profile and there is also high ownership concentration of the remaining holdings. Illiquidity, lack of transparency, volatility and capital charges may hinder widespread ownership. We believe advocacy of alternatives needs to be assessed within an enterprise capital return and risk management framework.
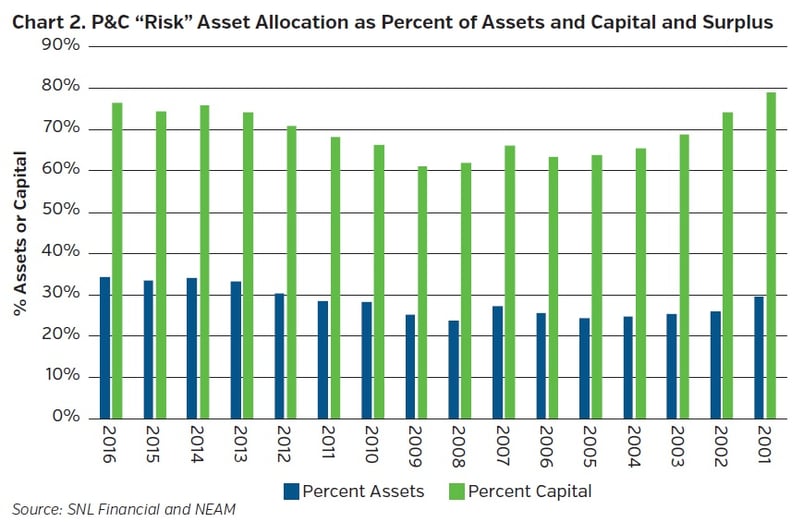
Table 3 shows earned investment income by broad asset class. Total earned income in 2016 decreased $1.3 billion from the prior year. The gross bond income declined 12 basis points (bps) to 3.14%, nearly 145 bps less than at year-end 2008, and 330 bps less than at year-end 1998 (not shown). The significance of the decline is twofold: first, the low-yield environment offers scant earnings relief to fragile underwriting results; and second, the timeline to achieve more robust embedded return continues to extend even if rising rates occur.
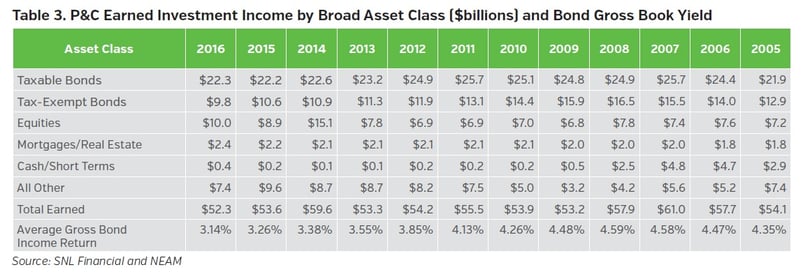
Table 4 displays fixed income sector allocations. The decline in municipal tax-exempts remains significant since 2008, possibly reflecting uncertainty of a continuation of more recently favorable underwriting results. Reduced Gov’t/Agency allocations might reflect their increasingly uncompetitive yields. Total structured securities remain largely the same, although their underlying composition has changed. The corporate allocation increases are the mirror opposite of municipal and Gov’t/Agency allocations.
Taxable municipal, non-dollar and private bonds are shown in the “Other” category totaling $71 billion at year-end 2016, a $3.2 billion increase from 2015. The ownership of non-dollar and private bonds remains very concentrated with upwards of 80% owned by 10 groups. Taxable municipals are more widely owned and their allocation is largely unchanged.
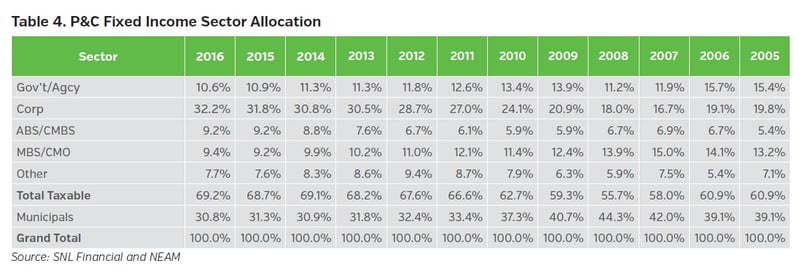
Table 5 displays option-adjusted duration (OAD) for fixed income sectors. The OAD statistics are based upon Schedule D holdings and exclude holding company bonds and all derivatives. Since 2005, the OAD difference between tax-preferenced and taxable bonds has averaged in excess of 2.5 years.
MBS/CMO holdings show a significant duration increase, nearly 1.5 years. For the 2016 analysis, NEAM switched data providers for selected securities from Bloomberg to Reuters. Whereas the reported duration increase is directionally similar to ICE BofA ML MBS/CMO Master Indices we believe that a significant portion of it is due to the provider change. We will provide an estimate of the magnitude of the provider change in a future edition of Perspectives.
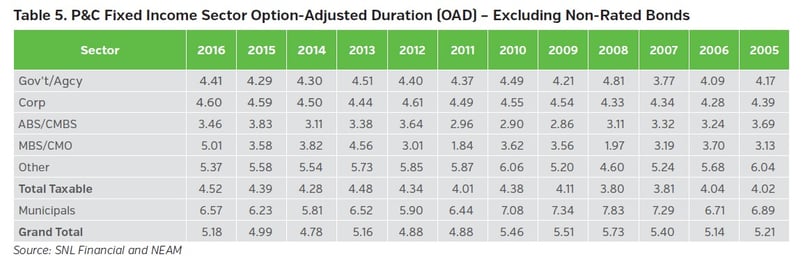
Table 6 shows book yield by fixed income sector. Across all sectors the aggregate decline in book yield was 8 bps, the lowest since 2008. Taxable book yields declined only 2 bps, whereas municipal book yields declined 22 bps, the largest amount shown. Within the taxable sector, book yields declined 9 bps for AAA/AA rated securities and 10 bps and 7 bps for single-A and triple-B securities, respectively. For below investment grade securities, reported book yields notched upwards 54 bps, possibly reflecting book value adjustments (not shown).
Within the municipal sector, the book yield decline among AAA/AA, A and triple-B-rated securities was 23 bps, 16 bps and 26 bps, respectively. Below investment grade holdings book yield increased 60 bps in 2016. In part, the reduction in yields was “self-inflicted,” reflecting gains that were taken during the year3. “Harvesting” gains, accelerating taxes (and increasing marginal rates) and suppressing future income and book yields have been a re-occurring phenomenon among select companies.
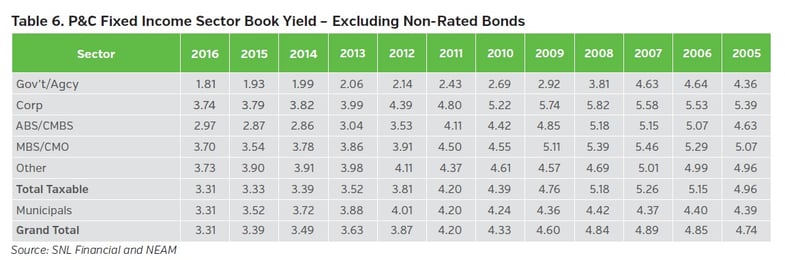
Chart 3 displays fixed income credit quality. As we have noted in previous issues, the 2008 fixed income credit quality shows widespread reduction of triple-A securities, reflecting downgrades in corporate and structured securities. The 2011 reduction in triple-A securities reflects Standard and Poor’s downgrade of U.S. Government securities. In 2012 credit quality weakened primarily as a consequence of purchases, not downgrades. This behavior commenced in 2011 and continued through 2016. At year-end 2016, the combined triple-BBB and below-BBB securities’ allocation of 21% was nearly three times the 2007 amount of 7.1%.
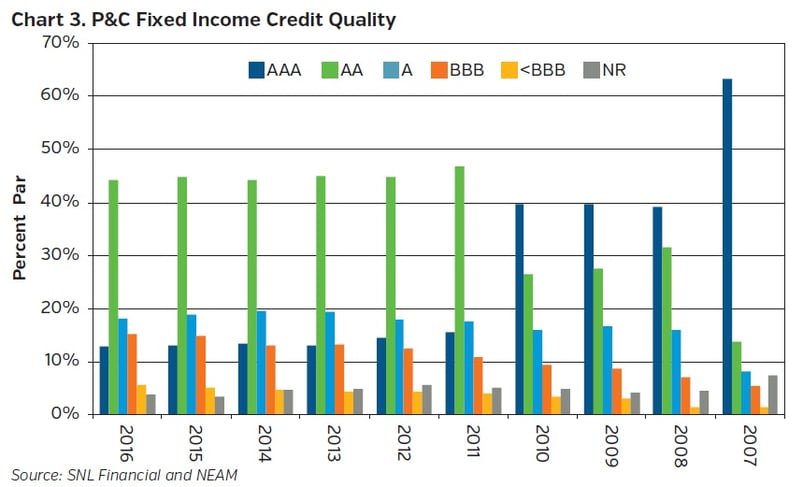
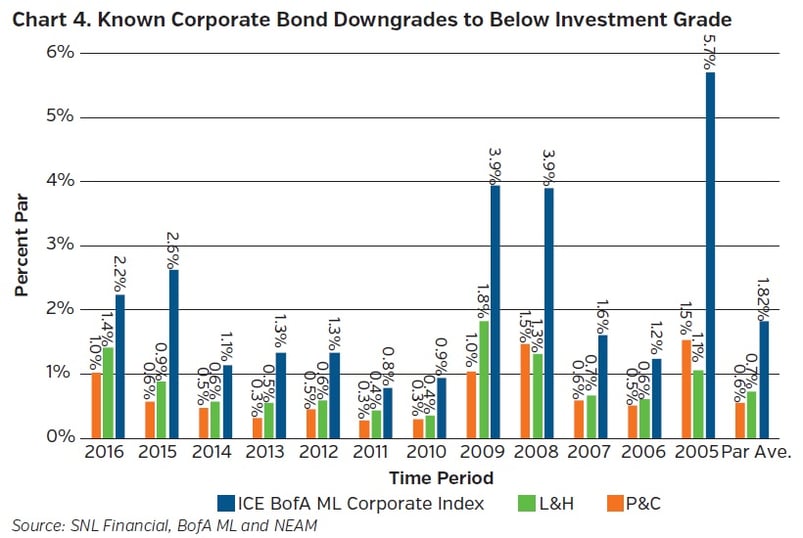
Chart 4 displays corporate bond downgrades to below investment grade ratings. We use the ICE BofA ML Investment Grade Corporate Index C0A0 to benchmark property-casualty and life insurance company results. The benchmark’s downgrades range from a low of .79% in 2011 to a high of 5.71% in 2005. The 2016 downgrades to below investment grade decreased to 2.25% of total par value from 2.63% the prior year.
The property-casualty insurance industry downgrade percentages range from a low of .28 in 2011 to a high of 1.54 in 2005. In 2016, the downgrade percentage increased to 1.02 from .57 from the prior year. The life industry investment grade corporate bond credit profile has greater skew to longer dated and lesser quality ratings than the property-casualty industry. Life industry downgrades ranged from a low of .36% of par value in 2010 to a high of 1.84% in 2009. In 2016, the downgrade percentage increased to 1.41% of par value from .88% in the prior year4.
Synopsis and Preview of Future Topics
Highlights of this Perspective’s review include:
- Industry combined ratio increased to 100.7, 3.5 points higher than the prior three-year average as premium rose 2.6%
- Net investment declined 2.9% to $47.4 billion, as invested assets increased 3.7% to $1,587.4 billion
- Book yields continue to decline as higher yielding securities are sold (especially tax-exempts) and/or mature and capital market replacement opportunities at comparable yields are not available
- Fixed income yields declined, while duration increased and credit quality lessened
- Below investment grade fixed income, equities and BA assets increased 2.1 percentage points to 77.6% of statutory capital and surplus
- Statutory capital increased 3.6% to $712.5 billion, reflecting net income and unrealized gains exceeding capital withdrawals
- Tax-preferenced municipal bonds (and possibly structured securities) appear to be underutilized assets
This Enterprise Based Asset Allocation™ review needs to be integrated with the organization’s business planning efforts to facilitate operational acceptance and successful execution. The review should incorporate realistic (achievable) underwriting goals and potential capital market outcomes. Future property-casualty insurance Perspectives will offer case studies.
We welcome your feedback and comments. Please contact us if there are investment themes you would like us to review or if you would like to receive a personalized comparative assessment, HealthCheck, of your investment portfolio.
Endnotes
1 Occasionally, we will reference results not appearing in charts and tables to explain the information that is presented. These details are available upon request.
2 For the three years ending 2004, premium and investment leverage averaged 1.15% and 2.75%, respectively.
3 The gross earned yield (derived from investment earnings) shown in Table 1 annually overstates actual book yield on average by 13 bps per year over the last 10 years. Gross earned income includes all bond income including that from bonds matured or disposed of during the year. Book yields shown in Table 6 represent the sum of book value weighted book yields of the bonds owned at year end.
4 The methodology used to measure insurance industry downgrades to below investment grade levels has a bias to understate downgrade activity. For that reason, it is difficult to make cross-company comparisons and caution is advised in reviewing the results relative to the benchmark. For all bonds the acquisition date is known and downgrades are known only for holdings owned at year-end. Thus, bonds bought and sold during the year are excluded. Similarly, bonds owned at the beginning of the year (prior year-end), but not at the following year-end, are excluded. This is because the sales date is unknown (from year-end holdings data) and the downgrade may have occurred after the bond was sold. The industry’s performance relative to the index begs the question: “Who were the unfortunate investors suffering the downgrades?”


