
In this issue of Perspectives, we review statutory operating and investment results for the U.S. life insurance industry over the last decade. Portfolio details focus on fixed income sector trends and market statistics (durations, yields and NRSRO ratings), which are maintained by NEAM in a proprietary database and are not publicly available.
In spite of declines in top-line revenue, pre-tax operating results for the industry improved slightly over 2014, due to favorable reserve reductions and lower surrenders. Consequently, the industry maintained the low double-digit return on equity, while increasing its capital and surplus.
U.S. life insurers continued to “search for yield” within this low rate environment. Mortgage loans have been favored by the industry since the 2009 financial crisis. Although the industry extended the duration of its fixed income portfolio in 2015, the duration movements varied by sectors, rating categories, and companies. The industry appeared to cautiously manage its credit, interest rate and liquidity risks while searching for yield in this challenging environment.
Financial Statement Summary Results
Table 1 provides a 10-year history of select statutory metrics for the U.S. life insurance industry. Overall, premiums and deposits were slightly lower than in 2014. Although life and accident and health (A&H) businesses experienced meaningful growth, lower deposits from annuities resulted in a revenue decline for the industry.
The favorable reserve changes, together with lower surrenders, more than offset the higher benefits and expenses in 2015. Even with the positive transfer of $36.9 billion to separate accounts, the overall industry’s total reported net income in 2015 was slightly better than the $37.6 billion the prior year. As a result, the return on equity increased slightly to a low double-digit of 11.2% from 11.0% in 2014.
General account assets rose 2% while separate account assets were unchanged in 2015. Over the past decade (2006 to 2015), total assets for the industry were up approximately 33%.
Table 1. Life Industry Highlights ($ Billions except Return on Equity)
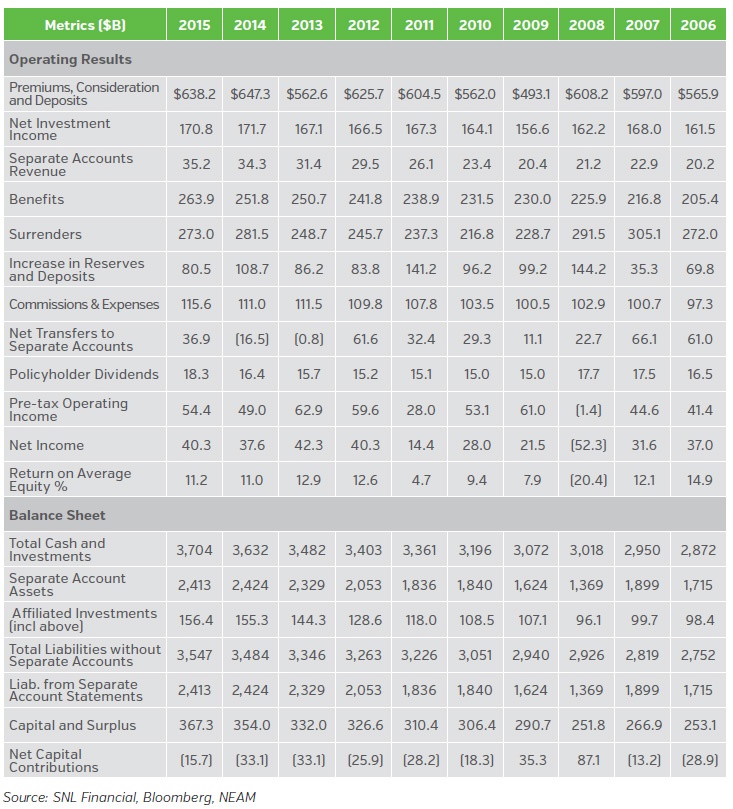
Chart 1 shows the composition of statutory investment results by their key components: earned investment income, realized gains/losses and change in unrealized gains/losses. Earned investment income has remained steady year over year since the financial crisis, although the overall invested assets rose 30% over this period. The notable negative unrealized G/L in 2015 was driven primarily by derivatives and schedule BA assets; however, the unrealized G/L results varied significantly across companies.
Chart 1. Statutory Investment Results Before Taxes and Expenses ($ Billions)
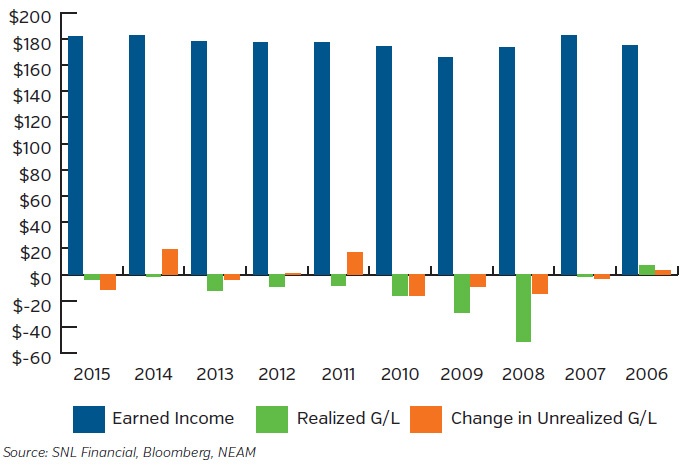
Table 2 shows earned investment income by broad asset classes. Total net earned investment income (net of expenses) declined by $1 billion, compared to 2014. Bonds and derivatives exhibited a combined $3.6 billion reduction in investment income, while equities and Schedule BA sectors experienced the most increase. The investment income from Schedule BA continued to rise, though this sector’s allocation as a percent of overall invested assets declined (see Table 3) from 4.9% to 4.7% in 2015. The reported Schedule BA statutory values went from $166 billion in 2014 to $159 billion in 2015. Average gross book yields have continued to decline approximately 10 to 20 bps annually since the 2009 financial crisis.
Table 2. Earned Investment Income by Broad Asset Class ($ Billions) and Fixed Income Gross Book Yield
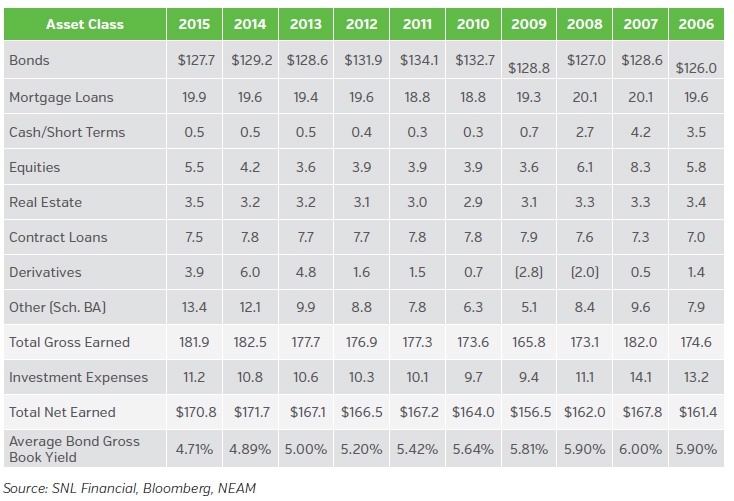
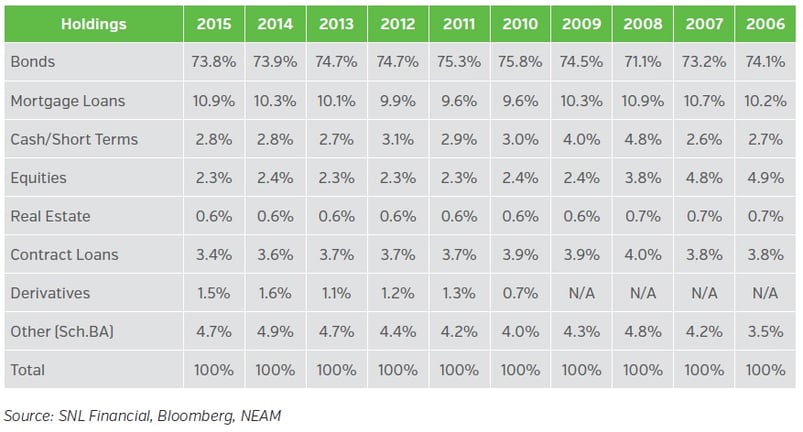
Table 3 shows that statutory allocations across broad asset classes remained mostly unchanged. Mortgage loans were the only sector to increase in 2015, as the life insurance industry has continued to favor this sector since the 2009 financial crisis. Allocations to schedule BA assets showed the first decline since 2010, due to the unrealized valuation decreases seen in both affiliated and unaffiliated holdings. These schedule BA assets remain highly concentrated among large companies.
Table 3. Life Broad Sector Asset Allocation
Portfolio Details
Table 4 displays fixed income sector allocations. The corporate sector showed the most increase in 2015 and its increased representation has outpaced all other sectors for the last 10 years.
With the exception of ABS and agency CMBS, allocations within structured securities have trended down since the financial crisis, with the biggest declines coming from agency RMBS and non-agency CMBS. Within the structured space, life insurers are focused on sectors which generate attractive yields relative to their rating categories. Within non-agency CMBS, life insurers’ interest has moved up the capital structure in response to weaker underwriting trends.
The allocation to municipal bonds, particularly taxable municipal bonds, continued to increase from less than 1% a decade ago to close to 4.5% in 2015. This increased allocation began in 2009-2010. The passage of the “American Recovery and Reinvestment Act” led to the creation of "Build America Bonds," which allowed municipalities and municipal authorities to raise debt, with the federal government providing a direct subsidy for 35% (or more) of the interest cost.
The allocation to privates remained steady for the last three years at 17%. Based on 2015 year-end statutory filings, the industry invested more than 50% of private placement securities in the BBB (NAIC 2) rating category. This is much higher than the BBB allocation seen in public fixed income securities (see Chart 2). As noted in prior articles, unlike the statutory Schedule D Part 1A reporting, our privates’ category excludes any 144A securities that are publicly traded.
The foreign category continued to be dominated by one group, which owned close to three-quarters of the industry’s total as of year-end 2015.
Table 4. Fixed Income Sector Allocation
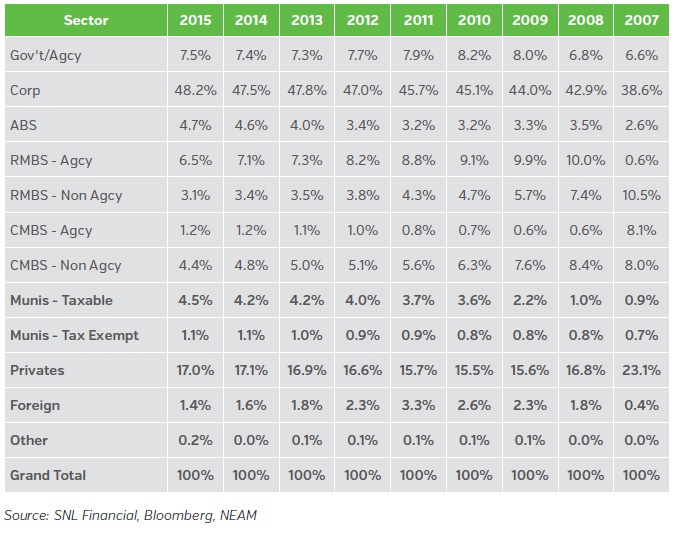
Table 5 displays the option-adjusted durations (OAD) by fixed income sector. After a minor shortening in 2014, the industry’s aggregate OAD lengthened in 2015 and reached the longest (7.44) since 2008 (5.49). However, the OAD movements continued to vary by sectors. In 2015, BofA ML broad Treasury and Agency Master, U.S. Corporate Master and MBS Master indices exhibited directionally-consistent duration movements.
The OADs for corporates, non-agency RMBS, agency CMBS and taxable municipal shortened, while the OADs for governments, ABS, agency RMBS, non-agency CMBS and tax-exempt municipal securities lengthened. The increase in ABS’s OAD trends maybe attributable to life insurers’ preference for longer duration and subordinate structure as they continue to search for yield-enhancing opportunities.
The OADs of municipal securities are on average higher than the combined OADs of the overall fixed income sector, as long-duration securities within this sector offer more attractive relative value than other sectors.
The foreign category’s relatively high OAD (14.27) continues to be driven by one group that owned a large amount of long-duration foreign government bonds. The foreign category’s OAD, excluding this dominating group, would be 9.44. The OAD statistics are based upon CUSIP level holdings extracted from Schedule D statutory filings and exclude any bonds held at the holding company level, derivatives and private placement securities.
Table 5. Fixed Income Sector Option Adjusted Duration (Years)
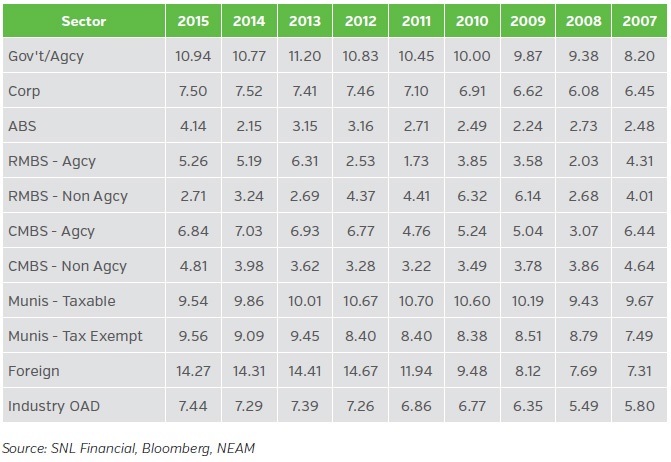
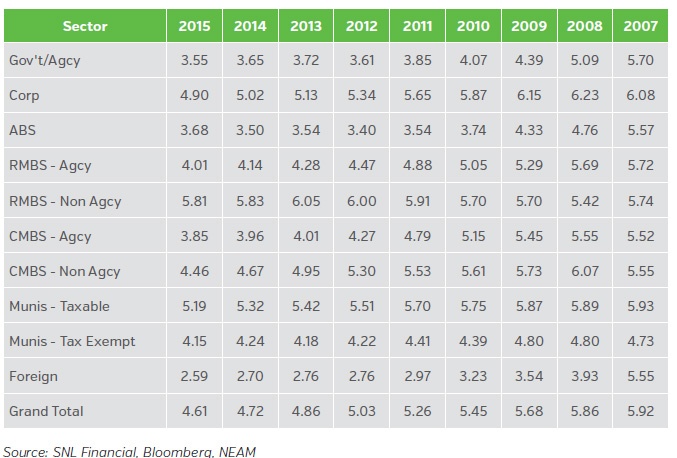
Table 6 displays book yields by fixed income sector. The book yields continued to decline since 2007 when the industry reached the highest aggregate book yield of 5.92%. The book yields across all sectors, except for ABS, declined in 2015 and the aggregate book yield declined by 11 bps. The ABS market continues to introduce new asset types, many of which offer incremental book yield. Cumulative reductions in the book yields of agency and non-agency CMBS reflect the runoff of seasoned pre-crisis exposures at higher book yields. Despite the tendency of life insurers to purchase longer maturity components of the CMBS capital structure, it has not been sufficient to replace historical yields in the sector. “True” private placement securities were excluded from the overall book yield calculations.
Table 6. Fixed Income Sector Book Yield (%)—Exclude Non-Rated (primarily private placement securities)
As highlighted in General ReView Issue 63, the 2008 allocation to AAA securities reduction was due to downgrades in corporate and structured securities, whereas the reduction in 2011 mostly reflected Standards & Poor’s downgrade of U.S. government securities. The changeover between the proportion of AAA and AA seen in 2013 was due to migration of AAA to lower-rated securities.
Chart 2. Fixed Income Credit Quality
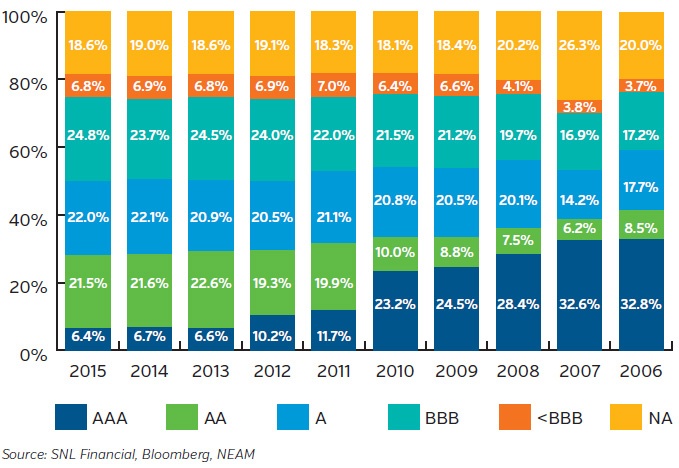
Table 7 displays the book yields for fixed income securities by credit rating categories. Total bond book yields continued to decline across all rating categories, with an aggregated decline of 11bps. The life insurance industry’s book yield reached the highest of 5.92 in 2007 and had declines of about 130 bps ever since. The higher rating categories, AAA and AA, experienced the most reduction of 172 bps over this period.
Table 7. Fixed Income Book Yields by Credit Rating Category
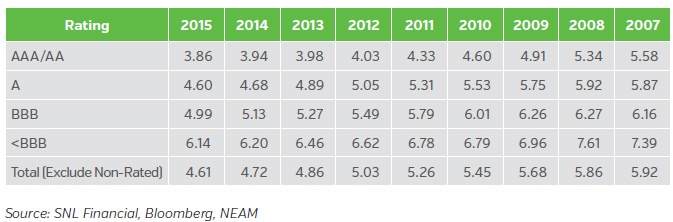
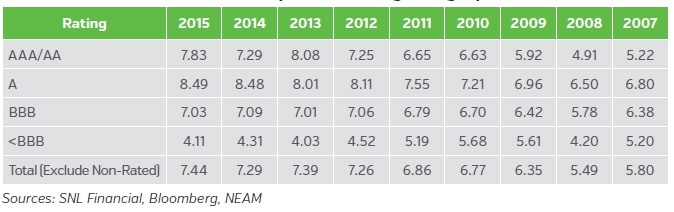
Table 8 displays the option-adjusted durations (OAD) for fixed income securities by credit rating categories. As shown earlier in Table 5, the industry’s aggregate OAD lengthened in 2015 and reached the longest (7.44) since 2008. OAD movements continued to vary by rating categories. In 2015, the AAA/AA rating category, which represented 28% of the life industry’s fixed income holdings, extended the duration by half a year, from 7.29 to 7.83. The high yield (<BBB) category (which the OAD shortened by 0.2 years) had limited impact on the industry’s aggregate OAD as it only represented less than 7% of the overall fixed income holdings. Non-rated securities (primarily privates), which accounted for 17% (see Table 4) of total fixed income holdings in 2015, were not included in the aggregate OAD calculations.
Table 8. Fixed Income Duration by Credit Rating Category (Years)
Highlights of this Perspective’s review include:
- The U.S. life insurance industry had lower premiums and deposits in 2015, but statutory operating results ended marginally better due to favorable reserve reductions and lower surrenders.
- The industry’s broad sector asset allocations remained largely unchanged. Only mortgage loans exhibited an increased allocation, while all other sectors showed reduced allocations.
- Allocations to schedule BA assets declined slightly, mainly driven by unrealized valuation decreases. The non-traditional assets remain highly concentrated among large companies.
- Structured securities’ allocations continued to trend down except for ABS. The industry is particularly active in subordinate structures in ABS, novel asset types and esoteric structures.
- Municipal bond allocations more than tripled from 1.6% in 2007 to 5.6% in 2015, with taxable municipal bonds exhibiting most of the growth.
- The BBB securities allocation reached a new high in 2015 and high yield (<BBB) allocations remained level (7%) after advantageous purchases during the 2008 financial crisis.
- Book yields continued to decline from 2007’s high of 5.92% to 4.61% in 2015. The higher rating categories, AAA and AA, experienced the most reduction of 172 bps in this period. In 2015, the book yields across all sectors declined, except for ABS, which had a 17 bps increase.
- Although the overall bond portfolio duration extended in 2015, durations for BBB securities and high yield (<BBB) shortened, as the industry cautiously managed the interest rate risk on lower-rated securities.
We welcome your feedback and comments. Please contact us if you would like to receive a personalized comparative assessment of your company versus peer companies.


