Executive Summary
This issue of General ReView first highlights statutory operating and investment results for the U.S. life insurance industry over the past 10 years. Portfolio Details then focus on fixed income sector trends and market statistics (durations, spreads and NRSO ratings). These historical market statistics are maintained by GR–NEAM in a proprietary database and are not publicly available.
Although the industry achieved record top-line revenue growth, pre-tax operating income declined nearly 25% due to high surrenders and unfavorable reserve increases. As a consequence, return on equity fell 200 basis points from the prior year. Despite a challenging low rate environment since the 2009 financial crisis, the industry has continued to grow its capital and surplus.
Anticipating the potential rate hikes, the U.S. life insurance industry continued to manage interest rate risk by maintaining duration at the current level. The observed repositioning of the industry’s bond portfolio credit and duration profile seems to indicate the relativevalue work employed by life insurance companies to take advantage of steepening credit curves following the oil and energy selloff.
Financial Statement Summary
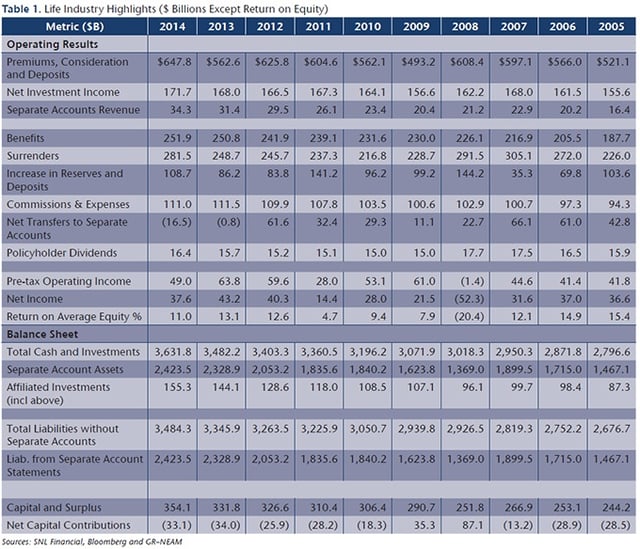
Table 1 provides a 10-year history of select statutory metrics for the U.S. life insurance industry. Premiums and deposits increased by 15%. Annuity business accounted for most (85% plus) of the overall industry’s revenue growth, while life and accident and health businesses grew only a marginal amount.
The favorable revenue growth in 2014 was partially offset by increases resulting from surrenders and reserve changes. The notable negative $16.5 billion transfers to separate accounts contributed to operating income and were primarily driven by both the individual and group annuity segments. However, these negative transfers and the favorable revenue growth are more than offset by increases in benefits and expenses. As a result, the overall industry’s total reported net income in 2014 ended up lower than 2013’s $43.2 billion.
General account and separate account assets both increased more than 4% in 2014. Overall, total assets for the industry rose approximately 42% over the past decade
(2005 to 2014).Table 1. Life Industry Highlights ($ Billions Except Return on Equity)
Sources: SNL Financial, Bloomberg and GR–NEAM
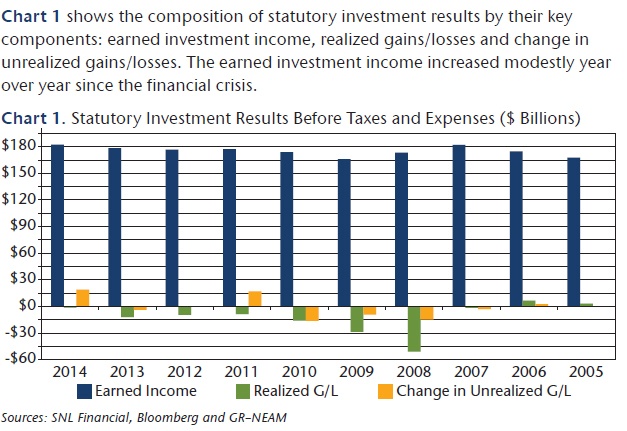
Chart 1 shows the composition of statutory investment results by their key components: earned investment income, realized gains/losses and change in unrealized gains/losses. The earned investment income increased modestly year over year since the financial crisis.
Chart 1. Statutory Investment Results Before Taxes and Expenses ($ Billions)
Sources: SNL Financial, Bloomberg and GR–NEAM
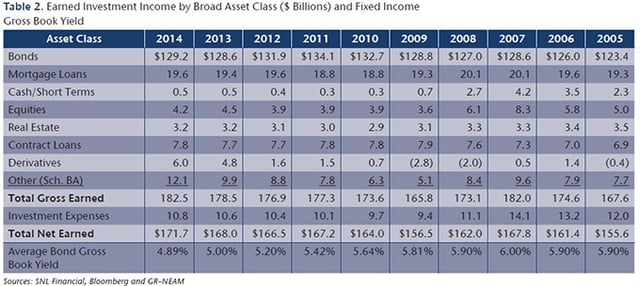
Table 2 shows earned investment income by broad asset classes. Total net earned investment income (net of expenses) rose by $3.8 billion compared to 2013, of which $3.4 billion of the increase came from Derivatives and Schedule BA sectors. Most asset classes showed increases with a notable exception of equities, which exhibited losses and cash/short terms and real estate which remained unchanged; however, equity only represents 2.4% (see Table 3) of the overall portfolio. The average book yields have declined by roughly 100 basis points since the 2009 U.S. financial crisis.
Table 2. Earned Investment Income by Broad Asset Class ($ Billions) and Fixed Income Gross Book Yield
Sources: SNL Financial, Bloomberg and GR–NEAM
Table 3 shows that statutory allocations across broad asset classes remained essentially unchanged. In 2014 life insurance companies slightly decreased their bond allocation in favor of mortgage loans, derivatives and other (Sch. BA assets) allocations. Allocations to other (Sch. BA assets) continued to increase but varied widely by companies. These Sch. BA assets (alternatives) encompass a wide range of long-term assets and are mostly concentrated among large companies1 (i.e., top 10 life companies own roughly 70% of the overall industry Sch. BA investments).
Table 3. Life Broad Sector Asset Allocation

Portfolio Details
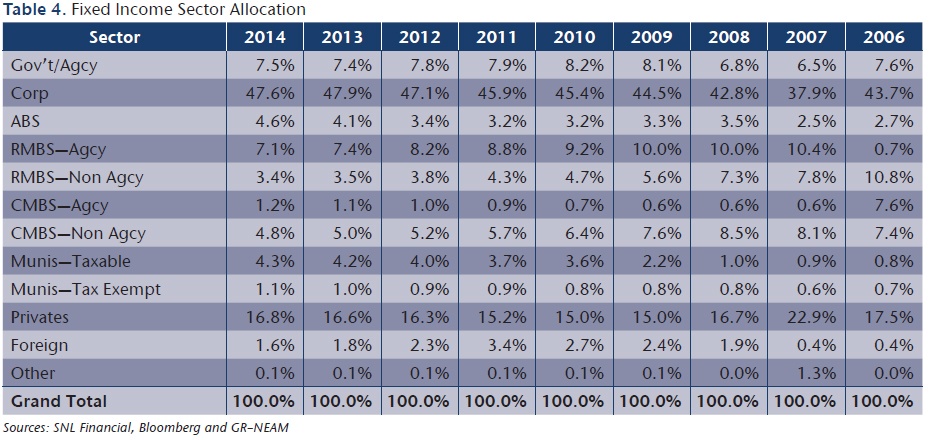
Table 4 displays fixed income sector allocations. Corporate bonds continue to dominate the fixed income allocation, although the percentage decreased slightly in 2014. Nonetheless, increased representation by the corporate sector has clearly outpaced all other sectors over the past five years. With the exception of ABS, allocations within structured securities have trended down since the financial crisis. While ABS issuance volumes have declined, they have continued to keep pace with pre-crisis levels. Life insurers have been active in the esoteric ABS arena. They are able to earn incremental yield to compensate for structural complexity, illiquidity premium and devote additional time and resources to conducting due diligence.
The allocation to municipal bonds, both taxable and tax-exempt, although still relatively small, continued to increase from less than 2% 10 years ago to close to 5.4% in 2014. The increased allocation to taxable municipal bonds began in 2009-2010. The passage of the “American Recovery and Reinvestment Act” led to the creation of “Build America Bonds,” which allowed municipalities and municipal authorities to raise debt with the federal government providing a direct subsidy for 35% (or more) of the interest cost.
The allocation to privates has continued to increase since the 2009 financial crisis and the ownership of private placement securities has remained very concentrated. As noted in prior issues of our General ReView, unlike the statutory Schedule D Part 1A reporting, the privates category excludes any 144A securities that are publically traded.
The foreign category continued to be dominated by one group, which owned close to three-quarters of the industry’s total as of year-end 2014.
Table 4. Fixed Income Sector Allocation
Sources: SNL Financial, Bloomberg and GR–NEAM
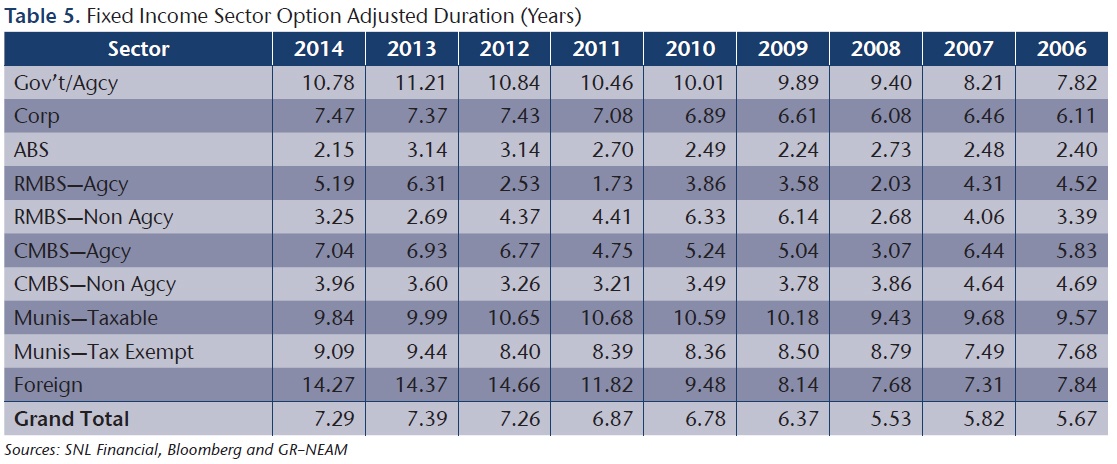
Table 5 displays the option-adjusted durations (OAD) by fixed income sector. For the first time since 2008, the industry’s aggregate OAD shortened; however, the OAD movements varied by sectors.
The OADs for governments, ABS, agency RMBS and municipal securities shortened, while the OADs for corporates, non-agency RMBS and CMBS lengthened. Though volatile, the OAD movement in agency RMBS mirrors the OAD movement in the BAML MBS Index. This suggests that life insurers reinvested prepayments and paydowns into current coupon agency MBS and longer duration-structured collateral (collateralized mortgage obligations or CMOs).
The OADs of municipal securities are on average higher than the combined OADs of the overall fixed income sector, as long-duration securities within this sector offer more attractive relative value than other sectors.
The foreign category’s relatively high OAD (14.27) continues to be driven by one group that owned a large amount of long-duration foreign government bonds; the foreign category’s OAD, excluding this dominating group, would be 8.91. The OAD statistics are based upon CUSIP level holdings extracted from Schedule D statutory filings and exclude any bonds held at the holding company level, derivatives and “true” private placement securities.
Table 5. Fixed Income Sector Option Adjusted Duration (Years)
Sources: SNL Financial, Bloomberg and GR–NEAM
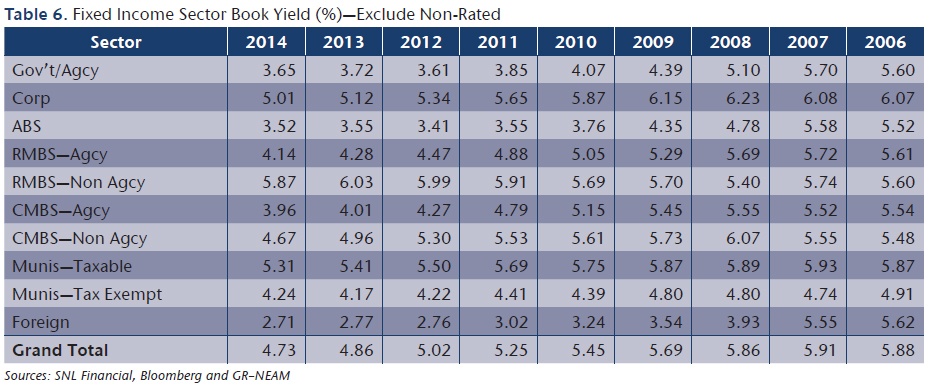
Table 6 displays book yields by fixed income sector. The book yields continued to decline since 2007 when the industry reached the highest aggregate book yield of 5.91%. Across all sectors in 2014, the aggregate book yield declined by 13 bps, with CMBS posting the greatest percentage drop. Cumulative reductions in the book yield of agency and non-agency CMBS reflect the runoff of seasoned pre-crisis exposures at higher book yields. Despite the tendency of life insurers to purchase longer maturity components of the CMBS capital structure, it has not been sufficient to replace historical yields in the sector.
The book yield decrease in the government/agency is partially due to the decrease in Treasury rates seen in 2014 (10-year Treasury started at 3.03% and ended at 2.17% for 2014). “True” private placement securities were excluded from the overall book yield calculations.
Table 6. Fixed Income Sector Book Yield (%)—Exclude Non-Rated
Sources: SNL Financial, Bloomberg and GR–NEAM
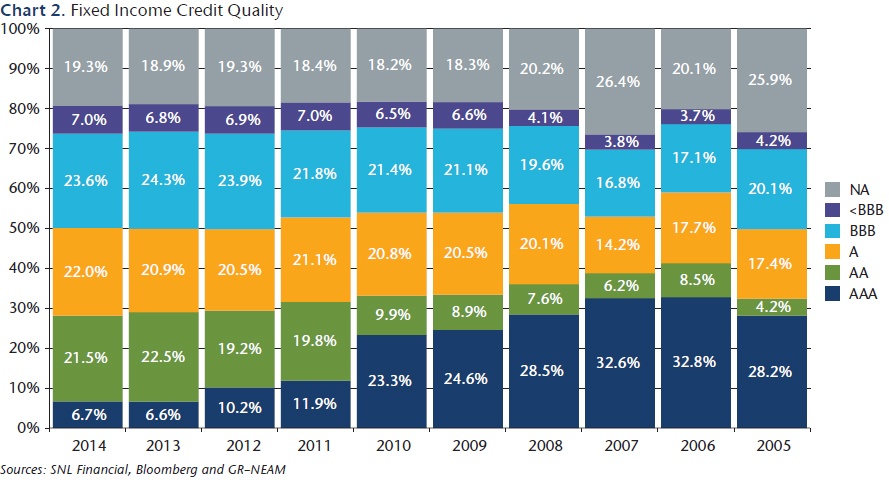
Chart 2 displays trends in fixed income credit quality. Since 2008, the allocation to investment grade securities remained largely unchanged. The high yield (<BBB) allocation continued to grow from under 4% in 2006 to 7% last year. The Triple-B securities allocation remained close to 24% over the last three years. The NA category is primarily driven by “true” private placement securities, which accounted for 16.8% (see Table 3) of total fixed income holdings in 2014. For private placement securities, based on 2014 year-end statutory filings, the life insurance industry invested mostly in the BBB (more than 50%) rating category, which was much higher than the BBB allocation (23.6%) seen in public fixed income securities.
As highlighted in General ReView Issue 63, the 2008 allocation to AAA securities reduction was due to downgrades in corporate and structured securities, whereas the reduction in 2011 mostly reflected Standards & Poor’s downgrade of U.S. government securities. The hangover between the proportion of AAA and AA seen in 2013 was due to migration of AAA to lower-rated securities.
Chart 2. Fixed Income Credit Quality
Sources: SNL Financial, Bloomberg and GR–NEAM
Table 7 displays the book yields for fixed income securities by credit rating categories. Total bond book yields declined across all rating categories, with an aggregated decline of 13bps. Since the 2008 financial crisis, the life insurance industry has experienced yield declines of about 114 bps, with both AAA/AA and <BBB rating categories exhibiting the most reduction of approximately 140 bps each.
Table 7. Fixed Income Book Yields by Credit Rating Category

Sources: SNL Financial, Bloomberg and GR–NEAM
Table 8 displays the option-adjusted durations (OAD) for fixed income securities by credit rating categories. Although duration extended across most rating categories in 2014, AAA/AA bonds, which represented 35% of the life industry fixed income holdings, experienced a significant average duration drop from 8.08 to 7.29. The AAA/
AA duration shortening could be driven purely by securities rolled-off or intentional relative value work at play. As a result, the overall bond duration shortened from 7.39 to 7.29. The 7.29 represents the industry’s “composite” OAD and is significantly longer than the industry’s “average” OAD of 6.37 and “median” OAD of 6.16. Nonrated securities (primarily privates), which accounted for 16.8% (see Table 3) of total fixed income holdings in 2014, were not included in the aggregate OAD calculations.
Table 8. Fixed Income Duration by Credit Rating Category (Years)

Sources: SNL Financial, Bloomberg and GR–NEAM
Chart 3 displays the 2014 YE fixed income portfolio credit and duration distribution; non-rated securities (primarily privates) were excluded in this chart. The OADs for the life insurance industry fixed income portfolio are centered between three and 15 years, where they represent more than two-thirds of the overall fixed income portfolio. Single A with 10-15 OAD and BBB with five to seven-year OAD shared the most weights of 6.6%.
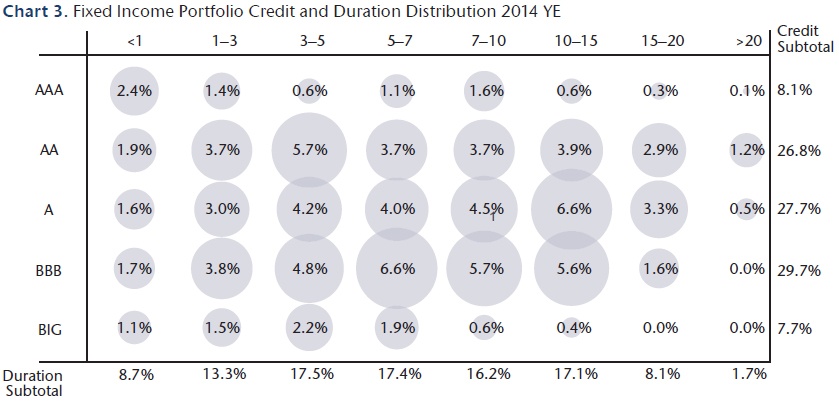
Table 9 displays how duration (OAD) and credit rating compositions for the fixed income portfolio migrated in 2014. The positive percentages represented the higher allocation in 2014 relative to 2013. The repositioning was partly due to curve changes and securities rolled-offs, but we believe there was also a fair amount of relative value work at play; i.e., sell shorter credit and buy longer since credit curves were steepening following the oil and energy selloff.
Table 9. Fixed Income Duration and Credit Rating Migration: 2014YE vs. 2013YE

Summary
The U.S. life insurance industry had a record year of favorable premiums and deposits in 2014, but the statutory operating results were largely offset by higher surrenders and increased reserve changes.
The broad sector asset allocations of the industry stayed essentially unchanged. Allocation to other (Schedule BA assets) continued to rise, but remained concentrated among the large companies. The industry’s net earned investment income increases in 2014 came mostly from Derivatives and Schedule BA categories, although results varied widely among individual companies.
With respect to the fixed income portfolio, allocations within the structured securities have trended down except for ABS. This is particularly evident in the esoteric ABS arena where incremental yield can be provided to compensate for underlying asset due diligence, structural complexity, and illiquidity premium. The allocation to municipal bonds, both taxable and tax-exempt, has more than doubled from under 2% in 2008 to 5.4% in 2014.
The shift of credit and duration profile of the life insurance industry in 2014 reflected partly the impact from rate or curve changes and partly the relative value work at play; i.e., sell shorter credit and buy longer credit since credit curves were steepening post the oil and energy selloff.
We welcome your feedback and comments. In particular, if you would like to receive a comparative review, please contact us.
Endnote
1 - Please see General ReView Issue 59—Alternative Investments: Who Owns What?


