This General ReView marks our 15th year of reporting on U.S. property/casualty (P&C) industry investment holdings. We are taking a slightly different approach this year by releasing three editions of the report. The first highlights overarching trends, while the second and third will delve deeper into several of the key issues. As in the past, companion pieces will follow for the life insurance industry.
The 2014 Investment Highlights are divided into three sections. The first summarizes financial results for the most recent 10 years. The next section highlights the major trends in asset allocation, fixed income risk metrics and “risk” assets, notably below investment grade fixed income securities, equities and schedule BA assets. And, the final section is a brief summary and preview of topics that will appear in future editions.
We encourage you to read this report to better understand how emerging themes from prior years will continue to have an impact on fixed income yields and earned income, and portfolio total return.
Financial Statement Summary Results
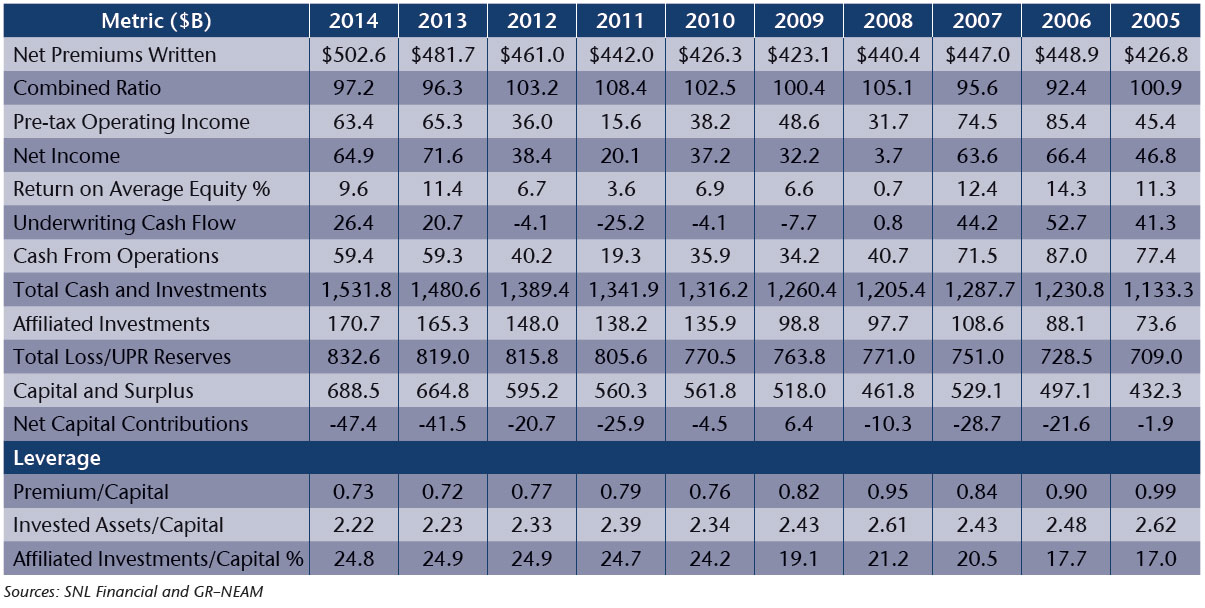
Net income for the year declined nearly $7 billion, reflecting lower realized capital gains and underwriting profit that was only partially offset by higher earned investment income. Underwriting cash flow improved slightly as a result of a 4% rise in premium and a decrease in paid claims. Cash and invested assets increased approximately 3.5%, while total reserves were up less than 2%—nearly all attributable to unearned premium reserves.
Reported statutory capital increased nearly $24 billion after the impact of share dividends and other adjustments. Since year-end 2004, statutory capital and surplus has compounded 9% annually after accounting for capital withdrawals and contributions. Leverage ratios remain low and essentially unchanged from the previous year. Affiliated investments as a percent of capital continue to be flat compared to prior years. Table 1 provides a 10-year history of select metrics for the P&C industry.
Table 1. P&C Industry Highlights ($ Billions Except Combined Ratio, Return on Equity and Leverage) 
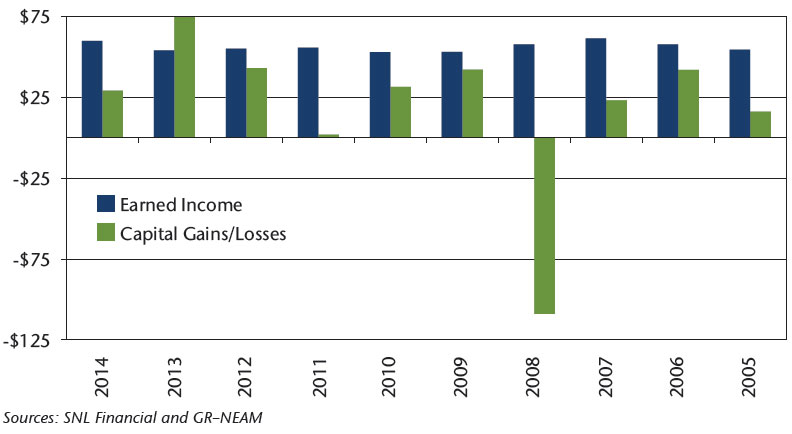
Chart 1 displays the composition of statutory investment results by their two key components: earned investment income and realized/unrealized capital gains and losses. Earned investment income increased nearly $6 billion as a rise in (affiliated) dividend income offset declines across all fixed income sectors. The large, yet still positive, decrease in capital gains was due primarily to common equity holdings (both affiliated and unaffiliated) and Schedule BA assets. U.S. government and, interestingly tax-exempt bonds, showed an increase in capital gains over the prior year.1
Chart 1. Statutory Investment Results Before Taxes and Expenses ($ Billions)

Table 2 shows the asset allocation across broad sectors. The allocation to tax-preferenced municipal bonds continued its slow downward progression from 2008 highs while all other sectors either ticked upward slightly or remained flat. The gradual erosion of the tax-preferenced municipal allocation is the most significant among all changes in broad sector allocations since the early 2000s and reflects changes in companies’ base underwriting results.
Table 2. P&C Broad Sector Asset Allocation

Our definition of “risk assets” are equities, Schedule BA assets and below investment grade fixed income securities. Table 3 displays the dollar value of risk assets and their amount as a percent of invested assets and capital. As a percent of capital, the 2014 and 2013 allocations remain below the peak year of 2001 when they reached 78.7% (not shown). The often heralded changes in Schedule BA assets (as an indicator of “alternative” asset allocations) is greatly overstated because of the undue influence of one company and the extreme ownership concentration among the remaining organizations. Their continued advocacy is particularly egregious in the context of diminished capacity for tax-preferenced income due to the eroding underwriting results noted above.2
Table 3. Risk Assets

Table 4 shows earned investment income by broad asset class. Total net of expense earned investment income increased nearly $6 billion from the prior year. This was due entirely to equities offsetting declines in every other asset category. Over 85% of the increase in equities was attributable to “affiliated” equity holdings, while the fixed income gross bond yield declined 19 bps to 3.57% from the prior year.
The decline in fixed income yield represents a decrease of nearly 135 bps from 2007–2008 and over 280 bps from the late 1990s (not shown). The significance of the decline is twofold: First, the current mean historic low yield environment offers scant earnings relief in a period of fragile underwriting; and second, the timeline to restore more robust embedded yields into portfolios continues to extend even as long anticipated rising rates begin to occur.
Table 4. Earned Investment Income by Broad Asset Class ($ Billions) and Fixed Income Gross Book Yield

Portfolio Details
Table 5 displays fixed income sector allocations. The retrenchment in municipal tax-exempt bonds has been significant since 2008, reflecting aforementioned inherent changes in the underwriting results of individual companies. Declining government/agency allocations reflect their increasingly uncompetitive yields, while the upswing in corporate bond allocations is the mirror opposite of both municipal and government/agency allocations. Overall, structured securities during the period remain largely unchanged.
Taxable municipal, non-dollar and private bonds are shown in the “Other” category. In aggregate these sub-categories totaled $73 billion at year-end 2014, representing a very modest $1 billion decline from 2013. The ownership of foreign and private bonds remains very concentrated among a few companies; 80% and 90%, respectively, are owned by 10 groups. Taxable municipals are more widely-owned; however, supply is very limited, narrowing opportunities to increase their allocation.
Table 5. Fixed Income Sector Allocation
Table 6 presents the option-adjusted duration (OAD) for fixed income sectors. In contrast to the prior year, 2014’s duration decreased in all sectors except corporate bonds. The MBS/CMO duration decline is directionally in line with the BofA ML MBS and CMO Master indices’ market cap weighted duration decline of 160 bps during 2014. The duration of structured securities has been very volatile over the entire reported period compared to other taxable sectors, which have been quite stable.
Municipal bond OAD decreased 70 bps during 2014 compared to the prior year’s 62 bps increase. The 2014 change is also directionally consistent with the BofA ML Municipal Master Index OAD 110 bps decline. The impact of purchases and sales varies by individual companies. In all cases OAD statistics are based upon Schedule D holdings of statutory filings, excluding any holding company bonds or derivatives.
Table 6. Fixed Income Sector Option-Adjusted Duration (OAD)—Excludes Non-rated Bonds

Municipal bonds remain the industry’s single largest asset class. Table 7 shows that municipal bonds represent 50% to 75% of bond portfolios for 61 companies.
These same companies owned about 48.4% of the industry’s tax-exempt bonds and, on average, they represented 59.7% of their fixed income holdings. Their numeric average and dollar-weighted OAD were 5.40 years and 5.71 years, respectively. Readers of prior issues of General ReView will recall that profitable underwriting organizations invest (very) large portions of their portfolios in (longer-dated) municipals.
Table 7. Municipal Bond Holding Distribution in 2014

Table 8 shows continued weakening of book yield by fixed income sector. Book yield declined, in aggregate, a total of 13 bps. In part the reduction in yields was “self-inflicted,” reflecting sales as much as purchases. Durations were shortened and gains were taken; however, this root cause of deterioration is less pronounced than in prior years.
Table 8. Fixed Income Sector Book Yield, Excluding Non-Rated Bonds

Chart 2 displays fixed income credit quality. As noted in previous issues of General ReView, the 2008 fixed income credit quality showed widespread reduction of triple-A securities, reflecting downgrades in corporate and structured securities.
The 2011 reduction in triple-A securities reflects Standard and Poor’s downgrade of U.S. government securities. In 2012 credit quality weakened as a consequence of purchases, not downgrades. This behavior commenced in 2011 and continued in 2014. At year-end 2014, the combined BBB and below-BBB securities’ allocation of 18% was nearly three times the 2005–2006 levels. And, except for 2009, the year-to year increases in securities rated less than A- were due, in greater part to purchases and sales rather than downgrades.
Chart 2. Fixed Income Credit Quality
Summary
This year’s summary is quite similar to the prior year’s:
- Risk assets represent a meaningful share of invested assets and capital, but their recent share of capital lags early 2000 levels.
- Allocations to non-traditional assets remain low, highly concentrated and illiquid.
- The tax preferenced municipal allocation continued to decline, driven by companies that have less capacity for tax-exempt income. This underscores weaker and less robust underwriting results.
- Credit quality has significantly eroded over the last decade. The most notable changes are the near tripling of BBB and below investment grade securities.
- Book yields continue to decline as higher yielding securities have been sold (especially tax-exempts) and/or matured and capital market replacement opportunities are eroding.
- Low embedded yields, the maturity structure of portfolios and nominal operating cash flows will significantly extend the time to restore fixed income asset yields and earned income to prior levels even as rates begin to rise.
In our view, the real concern is the combination of points four and five above and how their impact upon point six will affect prospective returns for the industry. In the next few issues of P/C industry General ReView, we will focus on changes in credit duration, corporate credit ratings migration and the long road to restoring fixed income book yields and investment earnings as interest rates.
We welcome your feedback and comments. Please contact us if there are investment themes you would like us to review, or if you would like to receive a comparative assessment of your investment portfolio.
Endnotes- Net realized capital gains within the tax-exempt sector is always a red-flag pertaining to underlying profitability of individual companies and/or the efficacy of their tax management.
- See the recent issues of General ReView; Issue #69 titled “‘Alternative’ Investments: Sirens of Promised Rapture” from April 2015, and Issue #59 titled “Alternative Investments: Who Owns What?” from November 2013.


