This is our 14th year of reporting on the U.S. property and casualty industry investment holdings. GR–NEAM’s database encompasses CUSIP holdings and their market statistics (durations, spreads, NRSO ratings, etc.) as of each year end since 2000. The year-end market statistics history cannot be replicated and we are unaware of it existing elsewhere. This enables GR–NEAM to provide greater depth of insurer portfolio analysis than what is otherwise available.
There are three sections in this General ReView. The first section provides a summary of financial results for 2013 and prior years. We believe it is important to review investments in the context of insurers’ operating results. Section two provides details on fixed income holdings and risk metrics. We highlight the increase in duration, the usage of floating rating securities as a duration management tool and the continued decline in credit quality. The final section provides a summary and preview of future companion articles presenting investment highlights.
Financial Results Overview
With respect to statutory (and GAAP) net income, 2013 proved to be a banner year although return on equity (ROE) lagged the highs of 2006–2007 due to the continued accumulation of capital. The dramatically improved operating income was the consequence of a significant improvement in underwriting results that reflect far fewer insured catastrophe losses. Investment results were very mixed with strong equity performance offset by declining earned investment income. The prospect of continued low interest rates and high equity valuations draw focus to the resilience of underwriting margins to drive double digit ROE if catastrophe events re-emerge.
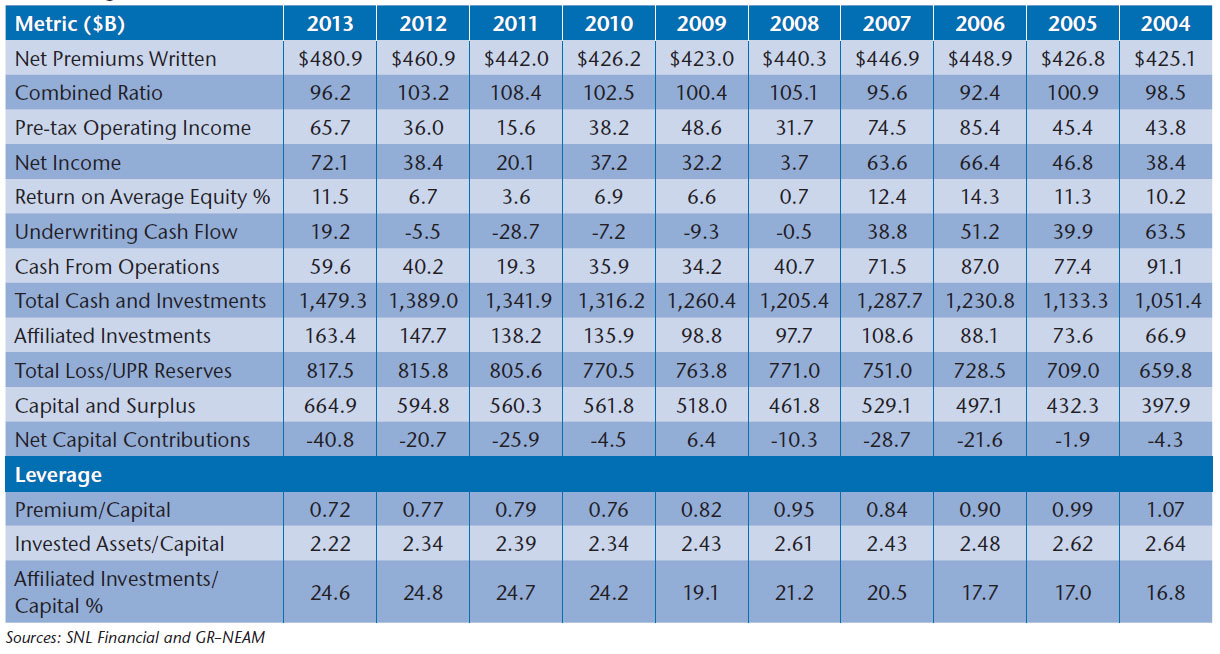
Table 1 provides a 10-year history of select metrics for the P&C industry. Premium income increased $20 billion, or 4% over the prior year. The combined ratio declined 7 points to 96.2 reflecting fewer catastrophe claims. Four of the five combined ratios since 1974 that were reported to be less than 100% have occurred in the 2003-2013 time frame. Net income at $72 billion reached an all-time record. Return on statutory capital increased to 11.5% resulting in a 10-year average after-tax return of 8.0% and an after-tax internal rate of return of about 5.7%. As expected, variations among companies are very significant.
Table 1. P&C Industry Highlights ($ Billions Except Combined Ratio, Return on Equity and Leverage)

Underwriting cash flow improved, turning to a positive $19 billion. Cash and invested assets increased $90 billion, or 6.5% over the prior year. Total reserves were about equal to the prior year while capital and surplus increased nearly 12% to $665 billion, reflecting the improved underwriting results and continued equity securities’ gains. Premium and investment leverage, the ratio of premium and invested assets to surplus, respectively, hit all-time lows. Excluding Berkshire Hathaway increases the respective leverage ratios 10 to 25 basis points (bps).
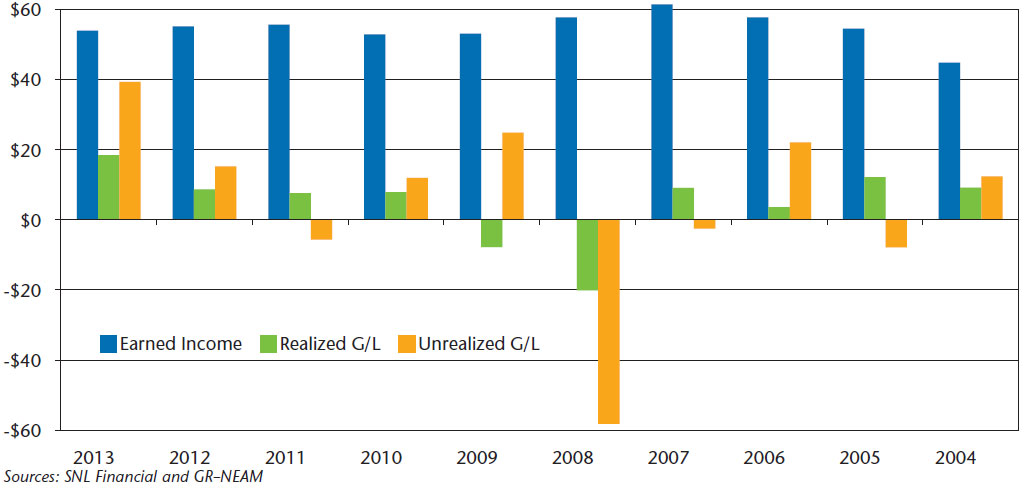
Chart 1 shows the composition of statutory investment results by their key components: earned investment income, realized gains/losses and change in unrealized gains/losses. Earned investment income declined slightly in total to $53.9 billion (about 2%) and across all invested asset categories except equities. Realized gains of $18.4 billion combined with the change in unrealized gains of $39.3 billion resulted in total pre-tax statutory investment returns of $111.5 billion, an increase of $32.6 billion, or 41% from 2012.
Chart 1. Statutory Investment Results Before Taxes and Expenses ($ Billions)

Table 2 suggests that statutory allocations across broad classifications were essentially unchanged after allowing for equity market appreciation. “Other” assets increased slightly. And, similar to prior years, this category remains very concentrated with one group owning 44% of the category and 10 groups owning over 80% (representing an increase in concentration). Despite widespread promotion, “alternative assets” appear to have limited acceptance.
Table 2. P&C Broad Sector Asset Allocation

Table 3 shows earned investment income by broad asset class. Total net of expense earned investment income decreased slightly ($1.2 billion) from the prior year. Fixed income assets earned investment income decreased reflecting declining book yields. “Equities” and “All Other” sectors’ income increased slightly from the prior year.
Table 3. Earned Investment Income by Broad Asset Class ($ Billions) and Fixed Income Gross Book Yield

Portfolio Details
Table 4 displays fixed income sector allocations. The municipal category includes only tax-exempt bonds. The retrenchment in tax-exempts has been significant since 2008, led by several large organizations with weakened underwriting results. The corporate bond allocation increases reflect the mirror-opposite municipal bond allocation changes. Structured securities and U.S. Government/Agency allocations are largely unchanged over the period.
Taxable municipal, non-dollar and private bonds are shown in the “Other” category. These categories totaled $67 billion at year-end 2013, a decline of $5 billion from 2012. Taxable municipal bonds had a slight uptick. The ownership of foreign and private bonds remains very concentrated among few companies: 80% and 90% respectively, are owned by groups. Taxable municipals are more widely held.
Table 4. Fixed Income Sector Allocation

Table 5 shows that total bond holdings option-adjusted duration (OAD) extended 29 basis points. Taxable bond duration changes were very mixed; however, the 155 bps increase in MBS/CMO moved the overall taxable OAD upward by 15 bps. By way of comparison, the BofA ML MBS and CMO Master indices’ durations extended nearly 350 bps and 200 bps, respectively, during 2013. OAD of structured securities has been very volatile over the entire reported period. In contrast, OAD has been very stable for all other taxable categories.
Municipal bond OAD increased 65 bps during 2013. This contrasts to a 55 bps increase in the BofA ML Municipal Master Index OAD. The remainder of the increase was due to purchases and sales during the year. Note that these statistics are based upon Schedule D holdings of statutory filings only and exclude any holding company bonds or derivatives.
Table 5. Fixed Income Sector Option-Adjusted Duration (OAD) – Excludes Non-rated Bonds

Municipal bonds remain the industry’s largest asset class. Table 6 shows that municipal bonds represent 50% to 75% of 62 companies’ bond portfolios. These same companies owned about 46.3% of the industry’s tax-exempt bonds and on average, they represented 60.4% of their fixed income holdings. Their numeric average and dollar-weighted OAD were 6.2 years and 6.5 years, respectively. Readers of prior issues of General ReView will recall that profitable underwriting organizations invest (very) large portions of their portfolios in (longer-dated) municipals.
Table 6. 2013 Municipal Bond Holding Distribution

Table 7 displays book yield by fixed income sector. Across all sectors the aggregate decline was 25 bps. Taxable bonds led the decline (30 bps) with all categories posting a reduction. Taxable yields have declined about 170 bps since their 2007 high from which OAD increased 68 bps. Tax-exempt yields declined 12 bps in 2013 and they have decreased 56 bps from their peak in 2008, at which time the OAD was 131 bps higher. In large part, the reduction in municipal yields was “self-inflicted,” reflecting sales as much as purchases, as durations were shortened and gains were taken. In 2013 municipal bonds gross book yield exceeded that of taxable bonds by over 34 bps.
Table 7. Fixed Income Sector Book Yield – Exclude Non-Rated

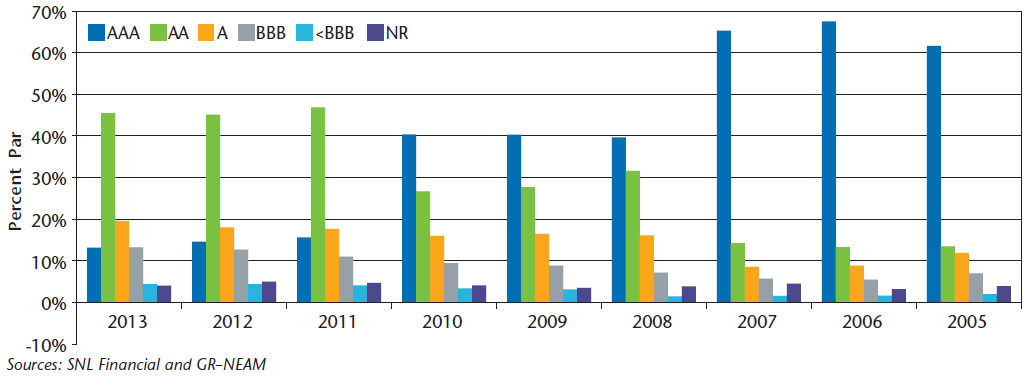
Chart 2 displays fixed income credit quality. As we have noted in previous issues of General ReView, the 2008 fixed income credit quality showed widespread reduction of triple-A securities reflecting corporate and structured securities’ downgrades. The 2011 reduction in triple-A securities reflects Standard and Poor’s downgrade of U.S. Government securities. In 2013 credit quality weakened as a consequence of purchases, not downgrades. This behavior commenced in 2011 and continued into 2013. At year-end 2013, triple-BBB and below-BBB securities represented three and two times, respectively, their 2008 allocations. Not-rated (NR) securities are unchanged.
Chart 2. Fixed Income Credit Quality

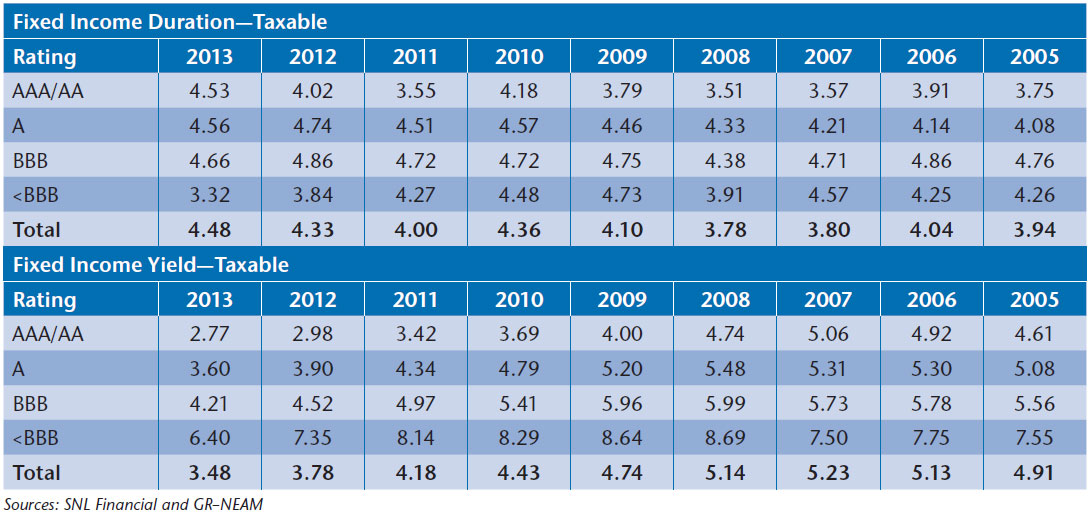
Table 8 displays the OAD and book yield for taxable bonds by credit rating. Taxable bond durations decreased for all rating categories except AAA/AA, which reflects the previously noted mortgage-backed securities extension. Taxable bonds’ OAD are the highest level over the reporting period. Taxable yields declined across all rating categories. Similar to 2012, the most severe yield decline was for below-BBB holdings.
Table 8. 2012 Taxable Bond Duration and Book Yields by Rating Category

Table 9. 2012 Tax Exempt Duration and Book Yields by Rating Category

Table 9. 2013 Tax Exempt Duration and Book Yields by Rating Category (cont.)

The increase in duration was the consequence of two factors. First, duration in the capital markets extended, in particular for structured securities and municipal bonds. Second, as we will share in the next General ReView, similar to last year the duration increase (and credit weakening) was the consequence of purchases and sales.
We will not opine whether the trading activity was the consequence of merely pursuing yield, but the duration increase was contrary to expectations in an environment cautioning interest rate risk due to rising rates. However, floating rate securities are a vehicle to mitigate the impact of rising rates without needlessly sacrificing yield. Table 10 summaries the ownership of these structures.
Table 10. Floating Rate Security Holdings at 2013 Year-End.

If focusing on broad averages, (column five—“Floaters %”) it would appear that ownership is rather uniform by size of company, say, in the range of four to five percent of total bonds. However, a more in-depth review reveals a strikingly high variation among companies. For example, the top five holders in the $1 billion to $5 billion size category have nearly 18% of their fixed income portfolio invested in floaters. This is in contrast to the 6.9% ownership of the top 10 companies in the $10 billion to $25 billion size category. The data suggest that meaningful ownership of floating rate securities is limited either in absolute amounts or as a percent of holdings.
Aggregating across broad asset classes and credit quality, we define “risk assets” as the sum of schedule D equities and below investment grade bonds and schedule BA assets (“Alternatives”). Their sum is shown in Table 11 below. The gradual increases in “Risk Assets” as a percent of assets and surplus is driven by increases in all three categories of risk assets: equities, schedule BA assets and below investment grade schedule D bonds. Below investment grade schedule D assets are widely held. Schedule BA assets are very concentrated.
Table 11. “Risk Assets” in $ Billions and As a Percent of Invested Assets and Capital & Surplus

Summary
At first blush, the reported record net income results would be cause for celebration. However, they were fueled by a sharp reduction in catastrophe losses, which when combined with current (prospective) low investment income returns would suggest an even still lower “required” combined ratio to achieve a better than low double digit 2013 return on equity. The increase in capital (pre-dividends) in 2013 was as much equally “financed” by a very buoyant equity market as by operating results.
Earned investment income continued to decline during the year. Allocations to non-traditional assets remain low and highly concentrated. Equity allocations increased but only due to unrealized gains. Taxable fixed income allocations increased as municipal allocations declined. The municipal bond allocation is at its lowest level in recent history, driven by large companies whose capacity for tax-exempt income has lessened reflecting weakened underwriting results.
Book yields continue to decline. However, the causes and magnitude of the decline differ as between taxable securities and tax-exempt securities. In the case of taxable securities, the yield decline was exacerbated by a relatively short duration profile, which in a declining yield environment accelerates loss of income due to reduced reinvestment rates.
“Interest rate risk” in the popular press focuses on lost opportunity to capture higher returns in a rising rate environment due to reduced pay-downs of long-dated portfolios. However, being short duration in a declining rate environment also has consequences. Floating rate securities are not widely held nor deeply held but for a few companies. However, they can mitigate the adverse consequence of rising rates but not declining rates.
The declining book yields of tax-exempt holdings were not immune from the declining market yield. However, on the one hand, the speed of its decline was lessened by reduced maturities from long duration portfolios. On the other hand, a portion of the decline was exacerbated by sales of municipals holdings’ highest yielding securities as some companies rotated toward taxable bonds in response to reduced tax-exempt income capacity. Purchasers of tax-exempt securities were unable to match the yields of these sellers, thereby lowering industry averages.
Similar to prior years, companion pieces will follow for the life insurance industry, and for both the non-life and life industry segments we will provide additional General ReView issues to address industry sub-segments, company variations and prospective returns. We do welcome your feedback and comments. In particular, if there are investment themes (or companies) you would like us to review please do contact us.


