Introduction
This is the second year GR–NEAM has performed a market analysis of publicly-traded, Bermuda domiciled insurers. Our goal is to highlight the peer group’s Financial and Stock Market Performance, Investment Performance, and Underwriting Performance. Additional analysis depicting firm-by-firm results and additional research will be forthcoming.
This research is composed of 16 firms with a combined $30.9 billion Net Earned Premiums, $128.5 billion Cash and Investments and $54.9 billion of Market Cap. The firms selected have a continuous financial reporting record and are publicly listed. The data is sourced primarily from SNL Financial (SNL) with additional research from annual filings, shareholder reports and stock market data. The firms and some pertinent high-level metrics are in Table 1.
Table 1. Peer Group

Financial and Stock Market Performance
Financial Highlights
In 2013 firms were once again pressed to maintain their discipline in a market flush with alternative capital. Strong equity markets allowed for advantageous IPOs from several firms. Even with additional competition, the peer group was able to deliver strong results while continuing to grow. Table 2 highlights their collective financial performance.
Table 2. Selected Financials and Performance

* Assured Guaranty and Enstar do not report traditional combined ratios and are excluded from related statistics.
** The Equity weighted composite is weighted by the “Equity Attributable to Common Stock.”
The peers were able to increase their Return on Average Equity (ROE) by 26% in 2013 driven by stronger underwriting performance with only three firms having lower ROE’s in 2013. The peer group outperformed the SNL U.S. Insurance Underwriter Index1 with an ROE of 12.5 versus 9.7 for the index. For the traditional Property & Casualty (P&C) firms,2 the median firm was able to generate an additional 9 points of underwriting margin with 13 of 14 firms decreasing their combined ratio. The equity weighted composite shows significantly better performance than the median, indicating outperformance by higher capitalized firms.
In addition to stronger performance on a ratio basis, firms were able to grow their business and balance sheets. Shareholder equity grew by 2.6% and Cash & Investments grew 3.3%. Net Earned Premiums also grew by 9.4% from $28.2 billion in 2012 to $30.9 billion in 2013.
Stock Performance 3
The average total return for the peer group outperformed the S&P in both 2013 and 2012. Chart 1 shows the peer group’s common stock total returns and the volatility associated with those returns. Our peer group did underperform the broader SNL U.S. Insurance Underwriter Index in both years but that index is comprised of a wider spectrum of firms and cap-weighted, which would overweight financially sound firms. Our peer group and the selected benchmarks all exhibited less volatility in the strong market of 2013 relative to 2012.
Chart 1. Stock Total Returns and Volatility

Valuation
The peer group’s valuations benefitted from strong returns in the overall stock market. In 2013 the peer group changed from trading at a discount of book value to a multiple as displayed in Table 3. As of year-end, eight firms trade at a premium to book value versus four in 2012. Two firms weigh down the peer group numbers with average price to book ratios from 2013 to 2009 of 61.3 and 78.4, respectively. The group’s P/E ratio increased slightly in 2013. The premium investors were willing to pay for a dollar of additional earnings grew by 5%. While these developments are positive, our peer groups still significantly trail the S&P 500 and SNL Index in both metrics.
Table 3. Price to Book & Price to Earnings Ratios of Peer Group

* The SNL U.S. Insurance Underwriter Index includes globally publicly traded (NYSE, NYSE MKT, NASDAQ and OTC) Insurance Underwriters in SNL’s coverage universe in P&C, Life and Health.
Capital Returned to Shareholders
Capital returned to shareholders increased in 2013, with the median firm returning 12% of their previous year’s market cap up from 7% in 2012. This was primarily accomplished through share repurchases that appear attractive given low price to book valuations. Twelve firms executed share repurchases (from 11 in 2012) with all but two increasing the dollars spent on repurchases. Total repurchases for the group grew from $2.47 billion to $3.71 billion far outpacing the S&P where share repurchases grew by 23.6% in 2013.4 Thirteen firms paid dividends both years with 11 increasing payout per share in 2013. Excluding a $2 special dividend by Validus, the average increase in dividends was 7%.
Investment Performance
Portfolio Total Return
Portfolio total returns slumped in the low interest rate environment as displayed by Chart 2. The average firm in our peer group had a total return on their portfolio of 2.81%, trailing their previous three-year average return by 95 bps (3.76 % average return from 2010–2012).
Chart 2. Portfolio Total Returns (As Reported)

Investment Income
Aggregate earned investment income dropped by 13% from $4.49 billion to $3.9 billion in 2013. Net investment income decreased from $4.35 billion to $3.17 billion but that reduction was partially offset by larger realized gains. Only seven firms were able to increase earned income from their portfolio in 2013 and net investment income increased in only four. The decrease in earned investment income is skewed by one firm taking $584 million of realized losses in 2012. Without this significant loss, earned income for our peer group would have been $5.07 billion in 2012 and aggregate earned income would have decreased by 23% in 2013.
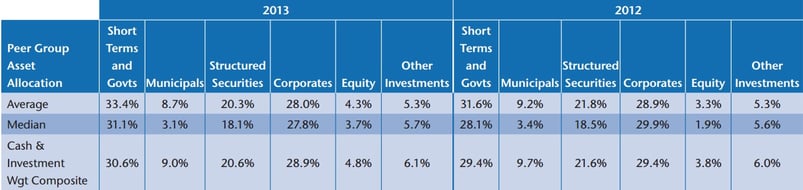
Asset allocation
Asset allocation in our peer group did not change significantly in 2013. Table 4 displays that the allocation to Short Terms and Governments increased slightly. Firms slightly decreased allocations to structured securities and corporate bonds. Allocations to municipals were largely unchanged and appear to be driven by U.S. operations. Equities rose year-over-year at least partially driven by a rise in global equity markets. Other investments, including CAT bonds, commercial mortgages and other alternatives, were largely unchanged in their allocation.
Table 4. Asset Allocation
Fixed Income Duration5
With the perceived threat of rising rates, the peer group appeared unwilling as a whole to add significant exposure to interest rate risk as displayed in Chart 3. The average duration was relatively unchanged and in line with reported durations over the past five years. While the averages leave little to report on, underneath the aggregated numbers lie some interesting data points. Eight of fifteen firms increased their duration by an average of 0.48 with the largest increase being 1.09. The other seven decreased duration by an average of 0.59 and the largest decrease was 1.10, truly a mixed bag of results.
Chart 3. Fixed Income Duration (As Reported)

Fixed Income Quality6
In an effort to maintain high investment yields on their portfolios in the headwinds of low rates and tightening spreads, firms added marginal amounts of credit risk. Table 5 shows that the average allocation to Below Investment Grade/Not Rated and Other increased slightly year-over-year, paired with a slight decrease in the AAA-A rated fixed income instruments. Individually, nine of 15 firms increased their allocation to Below Investment Grade and Other rated securities, with an average increase of 1.7% of their fixed income portfolio.
Relative to U.S. Statutory filers, the peer group falls in a “gray” area between the “on-shore” P&C and Life Industry. Their “A and Above” allocations are in line with the more conservative P&C industry and their high yield allocation is greater than the traditionally lower rated Life Industry.7
Table 5. Rating Distribution

Underwriting Performance8
Overview
Focusing solely on the P&C firms in our analysis, we delve into their underwriting performance with high level metrics shared in Table 6. Our peer group was able to perform significantly better on their books’ of business in 2013. Thirteen of 14 firms were able to lower their reported combined ratios with the only increase being marginal at less than a point. The median underwriting margins improved significantly from 94.9 in 2012 to 85.6 in 2013. Expense ratios were unchanged and median loss ratios decreased by approximately three points in 2013. In addition, firms were able to grow their businesses, significantly increasing both their Net Premiums Written and Recurring Revenue in 2013.
Table 6. Underwriting Performance Highlights

Catastrophe (CAT)
One of the major factors typically affecting the Bermuda (re)insurers is the impact of CATs and in Table 7 we attempt to capture the impact. The 2013 year was relatively benign with about 4 points of their combined ratios being attributed to CAT losses, compared to about 11 in 2012. Insurers accordingly experienced a 65% decrease in reported CAT losses ($2.73 billion in 2012 versus $958 million in 2013). Looking into the named events behind 2013’s losses, the biggest contributors were European flooding, U.S. storms and Canadian flooding.
Table 7. Catastrophe Impact on Combined Ratio

Reserve Development
Thirteen of our 14 P&C firms reported favorable development for the 2013 year on prior year reserves, with the 14th reporting no reserve development. The average development took 9.06 points off of the peer group’s combined ratio. This appears to be in line with 2012 results where 13 firms reported favorable development and a net reduction of 8.7 points to the combined ratio.
Summary
The peer group had a relatively successful and profitable year in 2013, driven largely by a decrease in CAT activity. Investors were rewarded with strong operating results and attractive total returns in part driven by active capital management. Investment portfolios fell short in achieving previous total returns and investment income and firms moved down the credit spectrum sacrificing quality for incremental return. Duration and broad sector allocations remained largely unchanged. Underwriting results were far more profitable with favorable reserve development and low CAT losses. Firms were also able to grow their books of business in a competitive underwriting environment.
In the future we will share more detailed results behind the findings presented in this paper. Our supplemental research will show the variation in companies’ results and explore additional topics including segment analysis, detailed operating results and additional portfolio analysis.
We welcome all comments and feedback on this work. If there are additional topics or areas you would like to suggest for our review, please feel free to contact us.
Endnotes
- The SNL U.S. Insurance Underwriter Index includes all insurance underwriters in SNL’s coverage universe whose primary shares trade on a U.S. exchange. It includes Life, Health and Property and Casualty firms that meet this criterion.
- Assured Guaranty (due to its financial guaranty nature) and Enstar Group (due to run-off nature) do not report traditional combined ratios.
- Essent Group is excluded from the stock performance, valuation and capital returned to shareholder sections as they went public in the latter half of 2013.
- Michael Amenta, 2014.
- Enstar is excluded from analysis of portfolio duration as they did not report the number.
- Aspen is excluded from ratings analysis as they reported on “A” rated or better at 88% in 2013 and 92% in 2012; Platinum’s percentage include short term investments; Argo’s BBB percent is not explicitly reported but was calculated based on the “A and Above” and “B and Below.”
- One caveat to the Statutory numbers are based on NAIC ratings rather than an NRSRO. Under the NAIC framework, Statutory filers could possibly get an advantageous ratings boost on non-agency RMBS and CMBS carried at appropriate book values.
- Assured Guaranty and Enstar Group are excluded from the Underwriting Performance analysis due to their respective financial guaranty and run-off businesses.


