Despite the historically low interest rate environment, 2012 turned out to be another year with favorable statutory operating results for the U.S. Life insurance industry. Although operating under challenging and competitive markets, Life companies continued to search for investment opportunities to enhance their risk-adjusted return.
This issue of General Review starts with highlights of the U.S. Life industry’s 10-year history of statutory operating and investment results and trends. The Portfolio Details section then focuses on fixed income sector trends and market statistics (durations, spreads, NRSO ratings, etc.); these historical market statistics are tracked internally by GR–NEAM and we believe that they are unavailable elsewhere in the marketplace. The Summary section concludes with key industry observations and trends.
Financial Statement Summary
Table 1 provides a 10-year history of select statutory metrics for the Life industry. Revenues from general accounts and separate accounts have continued to grow since bottoming in 2009 following the financial crisis. Annuity lines of business led the growth with premiums and deposits increasing more than 50% since 2009, while Life and Accident & Health businesses grew marginally.
Benefits and Surrenders increased slightly in 2012 while reserves and deposits charges decreased significantly from the prior year. Most of reserve reductions came from Variable Annuities (VA) business as the equity market rebounded in 2012 and reversed the reserve increase that followed the market downturn in 2008. Last year’s net transfer of $62B to separate accounts was nearly double the transfer in 2011and was primarily contained within the VA business. Industry profitability returned in 2012 with net income increasing to $41B, the most earned over the10-year period. Additionally, the industry achieved double-digit Return on Equity (12.8%) for the first time since the financial crisis.
General account assets have steadily increased over the last 10 years, while separate account assets have returned to pre-crisis levels after being negatively affected by the financial crisis. Overall, total assets for the industry increased about 50% over the past decade.
Capital and surplus for the industry continued to grow since the 2008 financial crisis. The industry saw significant increases in net capital contributions in 2008 and 2009 as it worked to restore its capital position.
Table 1. Life Industry Highlights ($ Billions except Return on Equity)
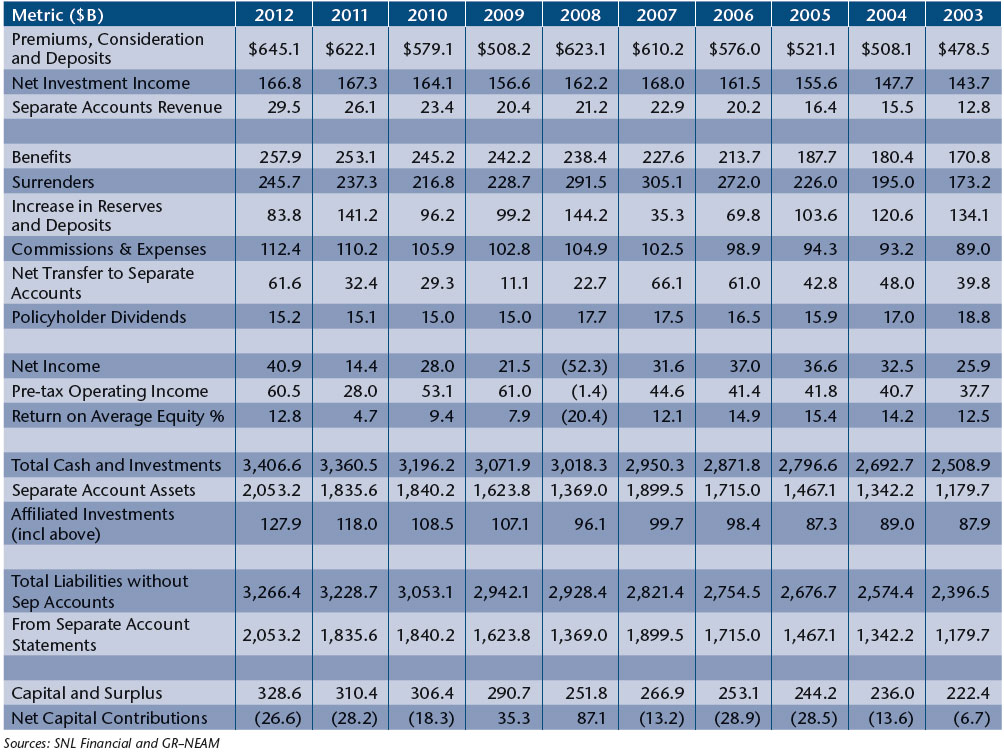
Chart 1 shows the composition of statutory investment results by their key components: earned investment income, realized gains/losses and change in unrealized gains/losses. Earned investment income and realized gains/losses remained unchanged for 2011 and 2012, while change in unrealized gains/losses was nearly zero for 2012.
Chart 1. Statutory Investment Results before Taxes and Expenses ($ Billions)
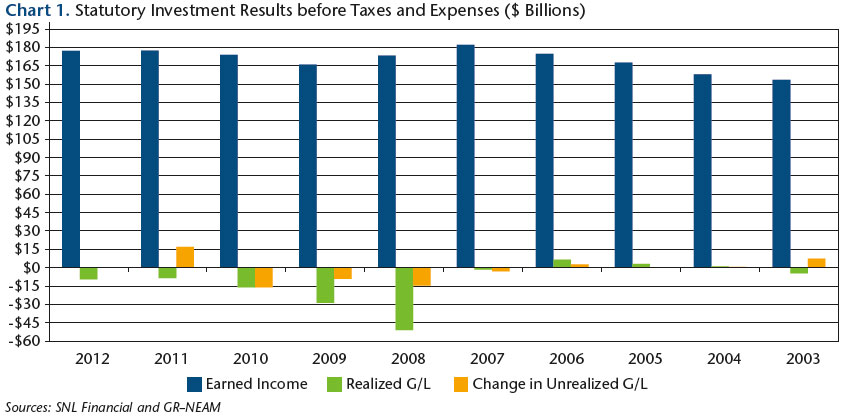
Chart 2 shows that statutory allocations across broad asset classes remained essentially unchanged. In 2012 Life insurance companies slightly decreased their bond allocation in favor of Mortgage Loans, Cash/Short Terms, and All Other allocations, which consists of Contract Loans, Derivatives and Other Investments. Allocation to “Other Investments (alternatives)” continued to increase but varied widely by companies.
Chart 2. Life Broad Sector Asset Allocation
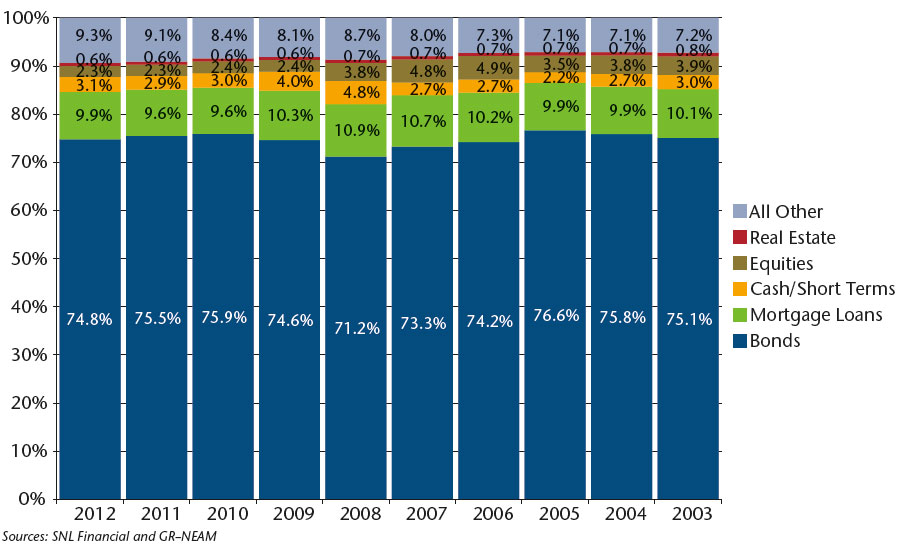
Table 2 shows earned investment income by broad asset classes. Total net of expense earned investment income decreased slightly ($500M) from 2011 due to the $2.2B decline in bond investment income that accompanied the continued decline in average book yield. Partially offsetting the decline in bond income was increased income from Mortgage Loans, Equities, and All Other sectors.
Table 2. Earned Investment ($Billions) and Fixed Income Gross Book Yield

Portfolio Details
Table 3 displays fixed income sector allocations. Corporate bonds and private placement allocations continued to increase, while RMBS and CMBS allocations continued to decline over the last five years. Since the financial crisis, the industry has continued to reduce its exposure to RMBS and CMBS and their combined allocations were reduced from 26.9% in 2007 to 17.4% in 2012.
Allocation to taxable municipal bonds, although still relatively small, quadrupled from the 2008 level. The allocation increase was due to the American Recovery and Reinvestment Act of 2009 (ARRA), which incentivized local governments to issue taxable municipal bonds. The program ended in 2010 and the upward trending in taxable municipal holdings is not expected to continue.
Unlike the statutory Schedule D part1A reporting, our Privates category excludes any 144A securities that are publically traded. The ownership of private placement securities was very concentrated: The top 20 largest companies, which accounted for 70% of the industry invested assets, owned 80% of the industry’s total private placement securities.
The “Foreign” category was dominated by one group, which owned 77% of the industry’s total.
Table 3. Fixed Income Sector Allocation
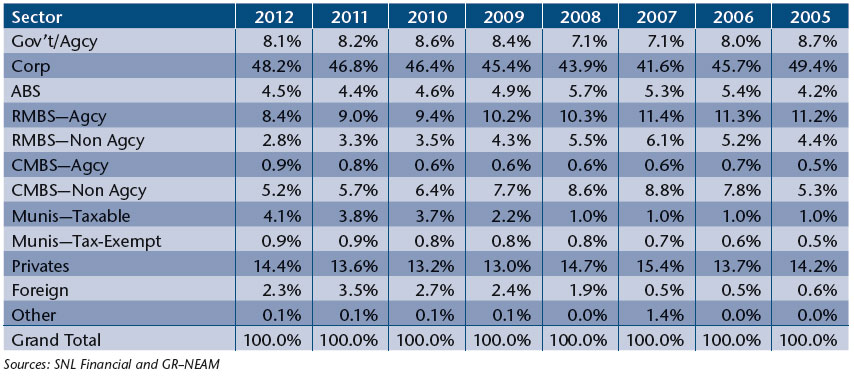
Table 4 displays the option-adjusted durations (OAD) by fixed income sector. Over the past five years, total bond duration has lengthened by more than 1.5 years as the industry stretched for yield. For 2012, the “Foreign” category’s 14.63 OAD was driven by one group that owned a large amount of long-duration foreign bonds. The OAD statistics are based upon cusip level holdings pulled from Schedule D statutory filings and exclude any bonds held at the holding company, derivatives, or “true” private placement securities.
Table 4. Adjusted Duration (OAD)
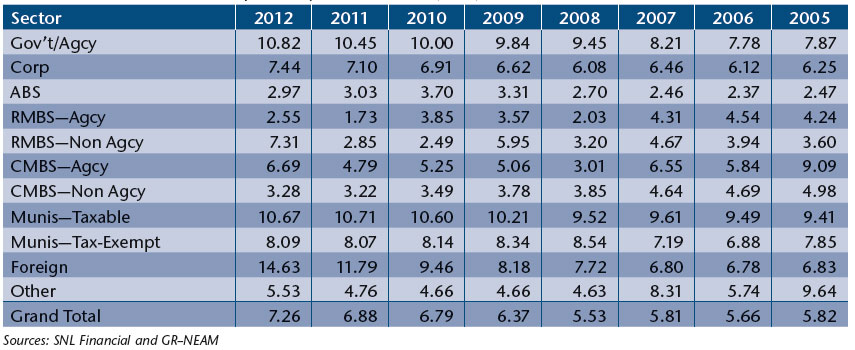
Table 5. Fixed Income Sector Book Yield
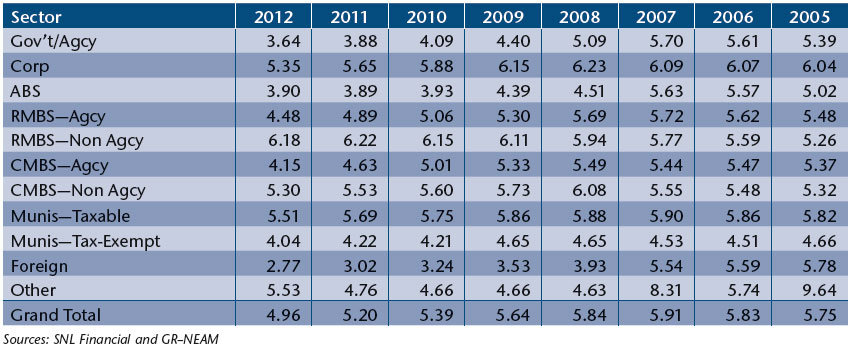
Chart 3 displays trends in fixed income credit quality. Over the past eight years, the allocation to triple-B and higher securities reduced slightly but remained unchanged.
The High Yield (<BBB) allocation continued to grow and triple-B securities allocation reached 24.6% in 2012, the highest level over the eight-year period. “NA” category is primarily driven by “true” private placement securities, which accounted for 14.4% of total fixed income holdings in 2012.
Beyond the broad trends, there were specific events that impacted credit quality. In 2008 allocation to triple-A securities fell by 6.6% due to corporate and structured securities’ downgrades, whereas the reduction in 2011 reflected Standard & Poor’s downgrade of U.S. Government securities.
Chart 3. Fixed Income Credit Quality
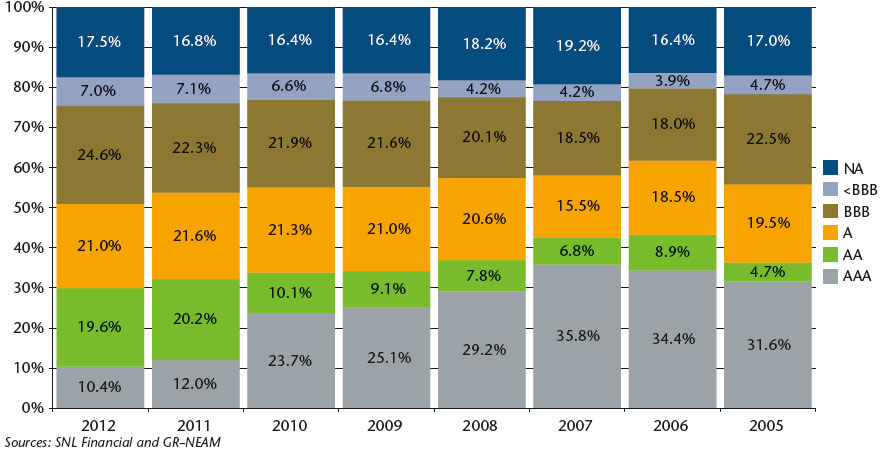
Table 6 displays the option-adjusted durations (OAD) for Fixed Income by credit rating. Over the last five years, the Life industry has gradually increased its overall duration by 1.7 years.1 In 2012 bond durations increased for each rating category except for below investment grade (BIG). The OADs for BIG have trended down since 2010 as the industry appeared to limit its duration (interest rate) risk for these securities. Non rated securities, which accounted for 17.5% of the fixed income holdings in 2012, were not included in the combined OAD calculations.
Table 6. Fixed Income Duration by Rating Category

Table 7 displays the book yields for Fixed Income by credit rating. Total bond book yields declined by 15 to 30 bps across all rating categories. Over the last five years, the Life and P&C industries have both experienced yield declines of comparable magnitudes.
Table 7. Fixed Income Book Yields by Rating Category

Summary
The U.S. Life industry had favorable statutory operating results in 2012 as Return on Equity reached double-digits (12.8%) for the first time since the financial crisis. That said, GAAP operating results for the top 24 public Life insurers didn’t reflect as stellar of a year.
The broad sector asset allocations of the industry remained unchanged between 2011 and 2012. Within fixed income sector, Life companies trimmed their exposures to RMBS/CMBS and opted for higher allocation to corporate bonds, “true” private placements and taxable municipal bonds.
To stretch for yield, the Life industry has invested in longer duration and lower credit fixed income securities. Single A and higher securities’ allocations continued to decline and currently are at the lowest level in the past eight years. While overall bond portfolio duration has increased, BIG fixed income durations fell as the industry sought to reduce its BIG interest rate risk. That being said, BIG allocations continue to grow.
In a future issue of General ReView, we will present findings from an in-depth investment analysis by Life industry segments (Life, Annuity, and Accident & Health), company-specific observations and variations, and fixed income securities transactions summaries.


