This General ReView has three sections. The first section presents a 10-year review of operating and investment results based upon statutory statement filings. The second section provides investment profiles based upon cusip level holdings data and GR–NEAM market analytics. The third section provides a summary.
The industry asset allocation moved from tax-exempt bonds, “other” holdings and cash towards corporate bonds. Credit quality lessened, reflecting the downgrade of U.S. Government bonds and a large increase in triple-B and below investment grade securities. The latter two categories now represent over 15% of fixed income holdings, double the 2006–2007 levels.
Earned investment income increased, reflecting both the sector allocation changes and credit weakening. The income and yield impact of the duration reduction of about one-half year was muted by the municipal to taxable rotation. The calculated duration reduction is at the cusip level, absent top-side duration management adjustments using derivatives. In the presence of low rates, yields, but not necessarily income, are due to erode further in 2012.
Financial Statement Summary Results
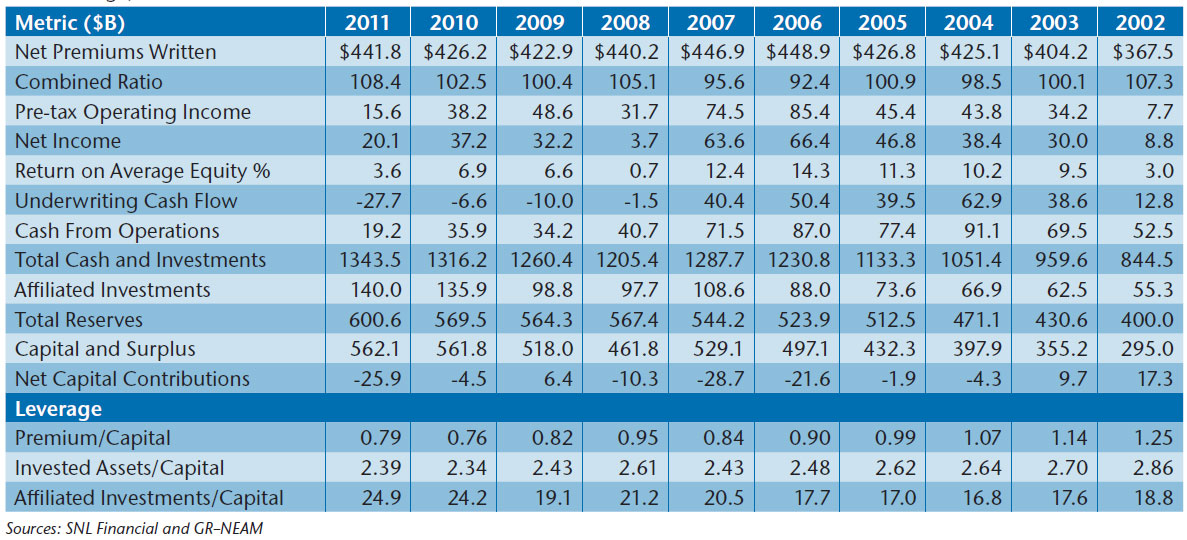
Table 1 provides a 10-year history of select metrics for the P&C industry. Premium income exceeded levels first recorded in 2005. The combined ratio was the highest over the 10-year period. Pre-tax operating income and net income are one-sixth and one-third, respectively, of their 2006 highs. Return on equity declined to 3.6%.
Table 1. P&C Industry Highlights ($Billions Except Combined Ratio, Return on Equity and Leverage)

Underwriting cash flow further deteriorated, driving operating cash flow to 10-year lows. Invested assets increased modestly over the prior year. Total reserves rose slightly reflecting the deteriorating combined ratio while capital and surplus remained flat as net income and capital withdrawals were about even. Premium and investment leverage increased slightly, the former well below its post-WWII high of 2.75:1 in 1974. The ratio of affiliated assets to capital continues to increase and it is driven by one group’s results.
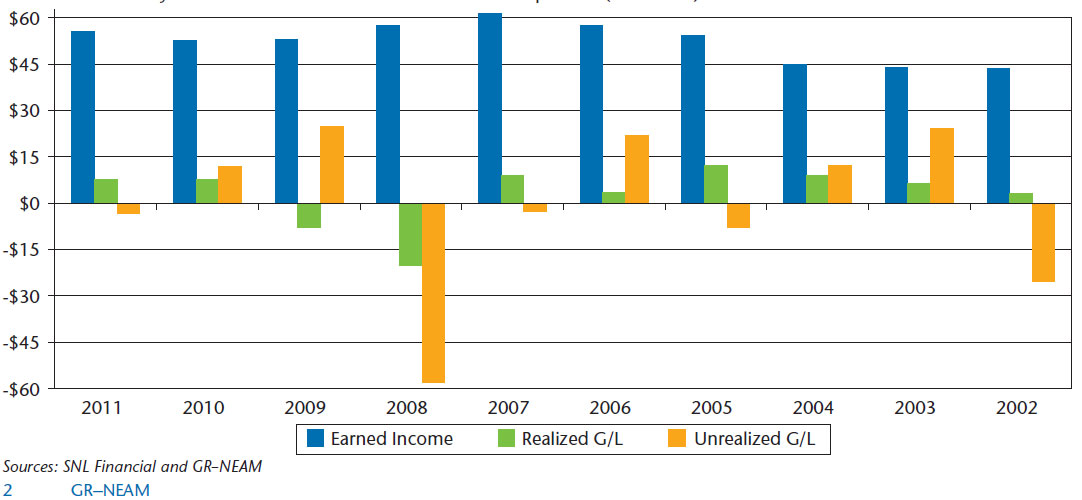
Chart 1 shows the composition of statutory investment results by their key components: earned investment income, realized gains/losses and change in unrealized gains/losses. Earned investment income in 2011 actually increased from 2010 while realized capital gains were about flat. The change in unrealized gains/losses reversed in 2011 causing the total contribution from investments to decline from about $72.5 billion to $60 billion.
Chart 1. Statutory Investment Results Before Taxes and Expenses ($ Billions)

Table 2 displays the asset allocation across broad sectors. The tax-exempt municipal bond allocation continued to decline, reflecting, among other factors, lessening capacity for tax-preferenced income. The reduced allocations to municipals and cash were redeployed to taxable bonds. “Other” assets’ ownership remains very concentrated: one group owns 48% of the sector, and five companies own two-thirds of the total.
Table 2. P&C Broad Sector Asset Allocation

Table 3 shows earned investment income by broad asset class. Earned investment income net of expense increased slightly from the prior year lead by the “other” category and the rotation to taxable bonds from tax-exempt bonds. Of particular note is the relative strength of “average gross book yields”: a loss of 17 bps and 15 bps for taxable and tax-exempt bonds, respectively, less than the prior years’ decline, slowed by purchases of higher yielding lower credit quality securities.
Table 3. Earned Investment Income by Broad Asset Class and Gross Book Yields

Portfolio Details
Table 4 displays fixed income sector allocations. This municipal category includes only tax-exempt bonds. The retrenchment in tax-exempts has been significant since 2008, led by several large organizations with weakened underwriting results. U.S. Government and Agency allocations were also pared back. Taxable municipal, non-dollar and private bonds are shown in the “other” category. Totaling over $65 billion in 2011, their portions are about equal. Corporate and non-dollar bonds had their allocations increased. Non-dollar and taxable municipal bonds have increased three-fold since 2005, albeit the ownership of the former is extremely concentrated among five groups owning 60% of the total.
Table 4. Fixed Income Sector Allocation

Table 5 displays the option adjusted duration (OAD) by fixed income sector. Total bond duration at year-end 2011 was about one-half year less than 2010. Taxable bond duration reductions occurred in all sub-sectors. However, except for MBS/CMO, the reductions were negligible. Tax-exempt duration declined nearly six-tenths of a year to 6.42 years. This reduction was due to a combination of curve roll, sales and purchases. The OAD statistics shown in the table are based upon cusip holdings detail, not “top-side” duration management using derivatives.
Table 5. Fixed Income Sector Option Adjusted Duration (OAD)

Municipal bonds remain the industry’s largest asset class. Table 6 shows that municipal bonds represent 50% to 75% of 60 companies’ bond portfolios. These same companies owned about 41.8% of the industry’s tax-exempt bonds and on average, they represented 61.7% of their fixed income holdings. Their numeric average and dollar-weighted option adjusted duration were 5.71 and 6.31 years, respectively.
Table 6. 2011 Municipal Bond Holdings’ Distribution

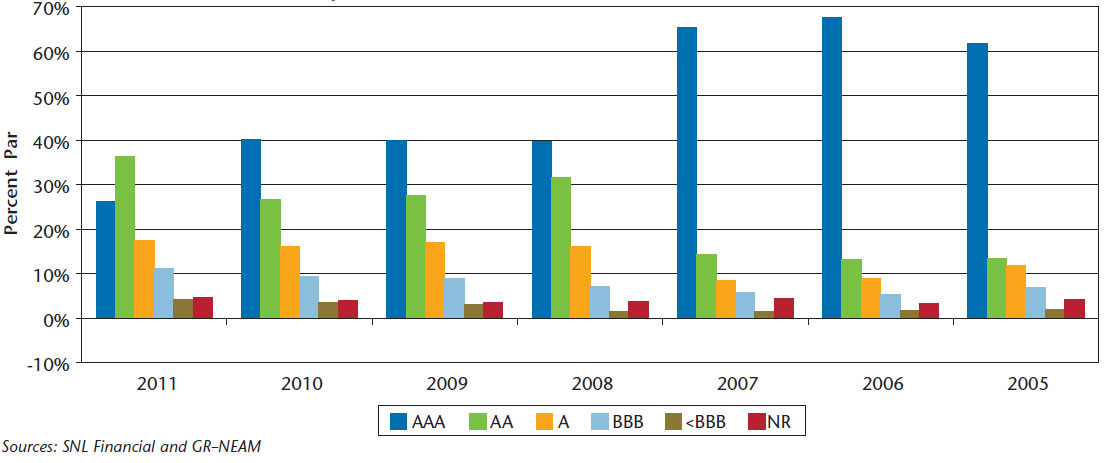
Chart 2 displays fixed income credit quality. In 2008, fixed income credit quality showed widespread reduction of triple-A securities reflecting corporate and structured securities’ downgrades. The 2011 reduction in triple-A securities reflects Standard and Poor’s downgrade of U.S. Government securities. Triple-B and below investment grade bond holdings increased to 11.1% and 4.2%, respectively, more than double their allocations in the 2005–2006 time frame. These increases were caused primarily by purchases, not downgrades.
Chart 2. Fixed Income Credit Quality

Table 7 displays book yield by fixed income sector. Across all sectors the aggregate decline was 17 bps. Taxable sectors led the decline (25 bps) with each sector except CMO (within the MBS/CMO category) posting a reduction. Tax-Exempt municipals’ decline was a scant 3 bps in 2011, 22 bps less than their high in 2008, when duration was greater by 1.4 years. Although the decline in book yield is serious, the current situation is not as grim as the popular press reports. The cusip holding analysis suggests that simple average “portfolio yields” seriously misstate the industry’s investment income results.
Table 7. Fixed Income Sector Book Yield

Summary
Taxable fixed income allocation increased as municipal bond and cash allocations declined. The municipal bond allocation is approaching the lowest level in the last 10 years. The reduced allocation is driven by companies whose capacity for tax-exempt income has lessened due to deteriorating underwriting results. Corporate bond allocation increased, absorbing nearly all of the reduction to municipals and cash. Allocations to non-traditional assets remains low and highly concentrated, and in fact declined during the year. Alternative assets are not yet widely embraced.
Earned investment income, although less than the 2006–2008 period, exceeded both 2010 and 2009. Unfortunately, book yields did decline, although not as severely as sometimes suggested. In part, the decline was slowed due to a lowering of credit quality, particularly at the single-A, triple-B and below investment grade credit levels.
Duration of portfolios declined during the year. The reduction was most severe with MBS/CMO and tax-exempt sectors. The MBS/CMO duration reduction is interest rate driven, repeating the 2007–2008 experience. The municipal bond reduction was driven by sales and a shorter duration profile of purchases than initial holdings. Large embedded unrealized capital gains, diminished tax-exempt income capacity and duration management, at the cusip level, were contributors to the decline in municipal duration.
In the next edition of General ReView we will look more closely at reserve volatility, issuer concentration, credit downgrades, credit duration, buy/sell durations and yields, prospective total returns and value-at-risk estimates at the industry level and by company. If you would like a profile report for your company (in relation to key competitors/peers), please contact us. Also, we welcome your feedback and comments.


