The last General ReView summarized property-casualty (P&C) insurers’ 2011 asset allocation and fixed income credit quality, duration and book yields. This edition provides details that underlie fixed income yield and risk metrics. There are two areas of focus. The first pertains to credit quality. The second addresses yields and risk metrics of insurers’ fixed income purchases and sales.
Credit quality of fixed income portfolios lessened in 2011 for two reasons: the downgrade of U.S. Government securities and purchases of lesser-rated securities. The former had a widespread impact. The latter was more concentrated among fewer companies. Fortunately, corporate securities’ downgrades had only a nominal impact upon insurer credit quality, and P&C companies’ downgrades trailed life companies and Bank of America Merrill Lynch (BofA ML) composites.
Taxable book yields declined primarily due to low purchase yields and the relatively high yield of securities sold. Taxable durations also fell, reflecting duration decay and purchase durations, which were less than sales duration. Tax-exempt yields declined but only by three basis points. Purchase durations were greater than those of sales. As discussed in the details, the results vary greatly by company, even among the largest firms.
Credit Matters
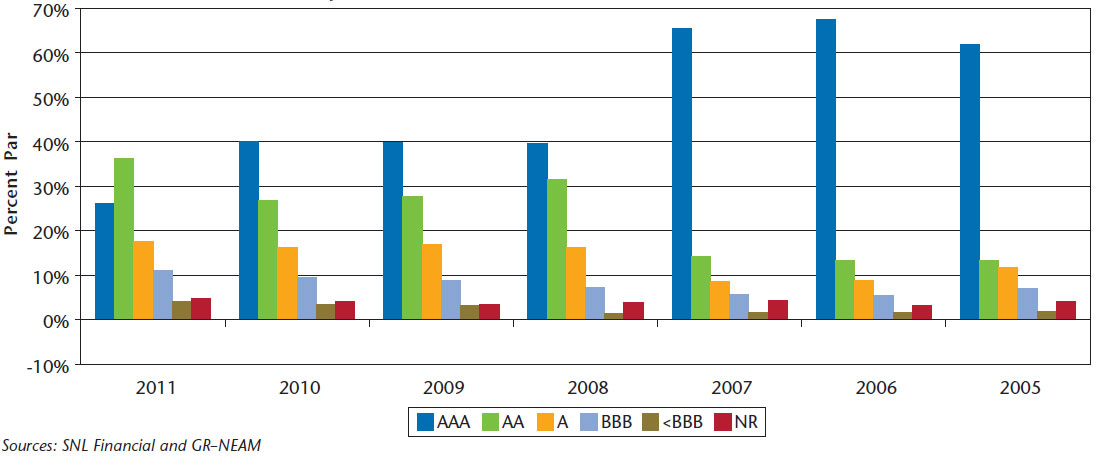
Chart 1 displays fixed income credit quality. In 2008, fixed income credit quality showed widespread reduction of triple-A securities, reflecting corporate and structured securities downgrades. The 2011 reduction in triple-A securities reflects the downgrade by Standard and Poor’s of U.S. Government Securities. Triple-B and below investment grade bond holdings increased to 11.1% and 4.2%, respectively, more than double their allocations in the 2005–2006 time frame. These increases were caused primarily by purchases, not downgrades.
Chart 1. Fixed Income Credit Quality

Table 1 displays credit quality by duration for 2011 corporate bond holdings. Similar to prior years, the allocation to lower credit quality diminishes as duration increases. The P&C corporate allocation to triple-B and below investment grade securities now exceeds 32% and 9%, respectively, very similar to Life companies, once again dispelling the myth that their respective corporate holdings’ credit profiles are different. The BofA ML Corporate Index triple-B and < triple-B percentages at year-end 2011 were 31.8% and 22.2%, respectively.
Table 1. 2011 Corporate Bond Credit Rating by Duration (OAD) Grouping

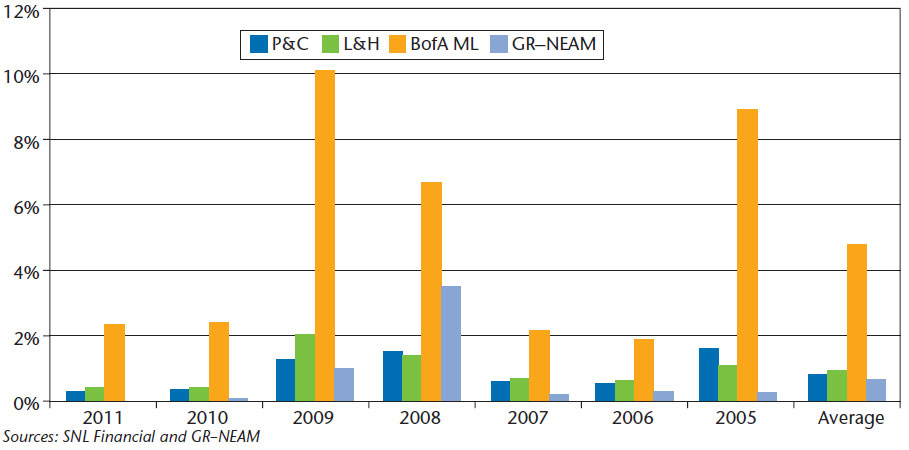
Corporate bond downgrades to below investment grade are shown in Chart 2, contrasting P&C and Life industry segments to the BofA ML U.S. Corporate Universe and GR–NEAM. Note the ratio of corporate holdings to statutory capital for Life companies greatly exceeds the ratio for P&C companies. Corporate downgrades for Life companies can become “a capital event.” Overall, insurers’ experience is more favorable than the broad market.
Chart 2. Corporate Bond Downgrades to Below Investment Grade (Percent Par)

Chasing Yield & Risk
Taxable bond sales turnover was a near-term low at 11% of beginning holding’s value. In absolute dollars and as a percent of beginning holdings, Allstate had the highest activity. With respect to purchases, AIG and Allstate lead the way: the former due to redeployment of sales from its municipal portfolios and the latter as it rotated its taxable holdings. With respect to tax-exempt bonds, AIG had the greatest dollar turnover but also the largest beginning tax-exempt portfolio.
Table 2 displays the book yield of taxable bond year-end holdings and intra-year transactions. For example, 2011 beginning holdings’ book yields were 4.41%. The ending book yield was 4.20%. Across companies, purchase yields were about 125 basis points less than yields on long-term bonds sold, continuing a pattern begun in 2007. The transactions exposed some companies to accelerated taxes and reduced book yields. The purchase yield destruction was not necessarily the consequence of low purchase durations or credit improvement, but rather, low market yields.
Table 2. Book Yield of Taxable Bond Holdings and Transactions
Table 3 presents option-adjusted duration (OAD) for taxable bond holdings and transactions. OAD ending in 2011 declined nearly four-tenths of a year, reflecting curve roll duration degradation and purchase OAD less than that of long-term bonds, which were sold. Whereas the “big reach for duration” occurred in 2010 (followed by 2011), the industry “sold” duration in 2011. And, worth mentioning, option-adjusted duration of mortgage securities collapsed in 2011, declining from 3.47 years to 1.97 years.
Table 3. Option-Adjusted Duration (OAD) of Taxable Bond Holdings and Transactions

Table 4 shows option-adjusted credit duration (OACD). This is an ordinal measure of risk rolled up from individual cusips: the greater the value of OACD, the greater the risk. As shown below, companies increased their appetite for risk. The increase in 2009 from 2008 was a “credit event” as a consequence of massive downgrades, i.e., companies “got stuck.” In 2010 and 2011, they bought greater credit-duration risk, as capital market yields further declined and spreads tightened.
Table 4. Option-Adjusted Credit Duration Risk of Taxable Bond Holdings and Transactions

Table 5 displays the book yield of tax-exempt holdings. The yield reduction in 2011 was very slight. Although the holdings’ yield continued to decline in 2011 from their peak in 2008, the yield degradation was the least since 2009 because yield on sales was less than the beginning of year embedded yield. In prior years, the opposite was true. Still, the yield on purchases remained low and as shown in the next table, it was not because of a wholesale retreat from “buying” duration.
Table 5. Book Yield of Tax-Exempt Bond Holdings and Transactions

Table 6 shows the duration of tax-exempt holdings and transactions. The OAD of purchases remains high, although among the lowest over the period. And, the duration of sales and calls, whose combined transaction value was 175% of purchases, was well below beginning OAD. Hence, transactions were a “drag” on duration and combined with curve roll degradation resulted in a six-tenths of a year OAD reduction, the largest over the period.
Table 6. Option-Adjusted Duration (OAD) of Taxable Bond Holdings and Transactions

Table 7 presents the option-adjusted credit duration of tax-exempt holdings and transactions. It declined during the year due to the reduction in OAD noted above. Unlike taxable bond holding, credit had little role in changes to tax-exempt OACD over the period.
Table 7. Option-Adjusted Credit Duration Risk of Taxable Bond Holdings and Transactions

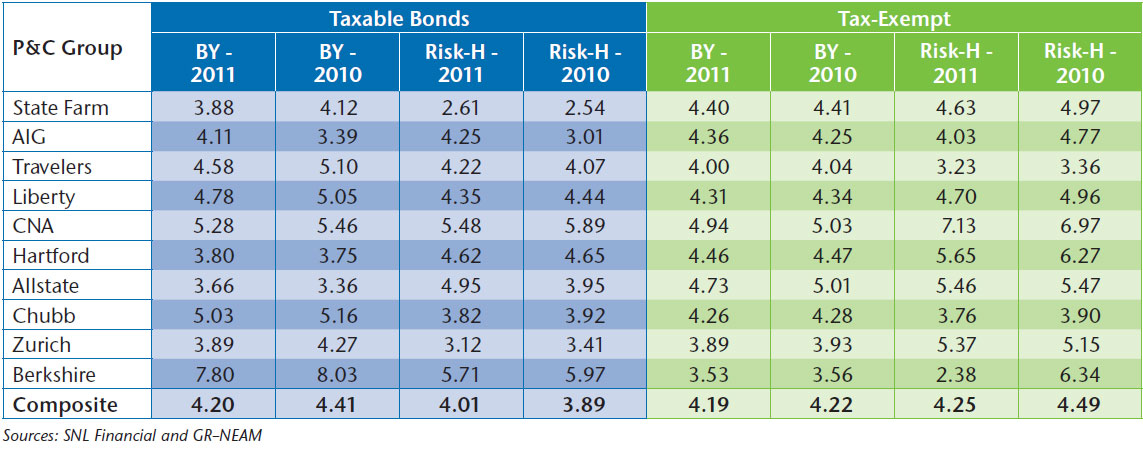
Table 8 presents the change in taxable and tax-exempt yields and risk for the ten largest companies measured by fixed income holdings. AIG and Allstate experienced the greatest increase in taxable yields and risk. In the case of AIG, the increase in yields was due to purchase yields greater than 2010 holdings’ yields and a large amount of very low yielding securities that ran off during the year. AIG was also a “buyer of risk” during the year as was similarly the case for Allstate, which experienced a smaller increase in book yield. The tax-exempt standout was Berkshire, which on purchases and sales reduced risk as it pared its municipal allocation, albeit with only slight yield degradation.
Table 8. Ten Largest Companies Change in Book Yield (BY) and Risk

Summary
Taxable book yields declined modestly (21 bps) in 2011 and risk modestly increased. Whereas there is a “story” for every company, risk extension overall was primarily credit driven. Tax-exempt book yield declined very slightly (3 bps) as risk was reduced, in this case primarily due to duration reductions.
The next General ReView will address prospective return profiles on fixed income holdings, contrasting them to 2010 holdings. We will also discuss the ownership of “non-traditional” U.S. P&C portfolio assets, i.e., Schedule BA assets and non-U.S. dollar securities. As always, reader feedback is appreciated.


