
In this Perspectives, we focus on 2015 investment results and key operating metrics for the U.S. property - casualty insurance industry. This is our 16th consecutive year of producing two annual industry publications. The first report highlights overarching trends. The second, builds upon these trends by providing a range of prospective returns and identifying steps to enhance future results in light of current market conditions.
This issue of Perspectives is divided into three sections:
- Financial statement summary results and broad asset allocation trends for the past 10 years
- Portfolio details: highlights of fixed income risk metrics and yields, and observations specifically relating to municipal bond asset allocations and results
- A brief synopsis and preview of future topics
Financial Statement Summary Results
Table 1 provides a 10-year history of select metrics for the U.S. property-casualty insurance industry. Net income in 2015 declined nearly $7 billion due to reduced investment earnings and a slight deterioration in underwriting profit. Statutory capital was flat in 2015, as unrealized losses and capital withdrawals offset contributions from net income. Return on average equity was 8.5%, equal to the annualized after-tax total return since 2001, after accounting for capital withdrawals and contributions (not shown)1. Leverage ratios remain low.
Underwriting and operating cash flow changed modestly from the prior year. Cash and invested assets were unchanged, while total reserves increased approximately 2% – equally spread across loss reserves and unearned premium reserves. Nominal underwriting gains, declining investment yields and low leverage combined to generate single digit returns on equity: a possible, and not too promising, portent for the future.
Table 1. P&C Industry Highlights ($Billions except Combined Ratio, Return on Equity and Leverage)
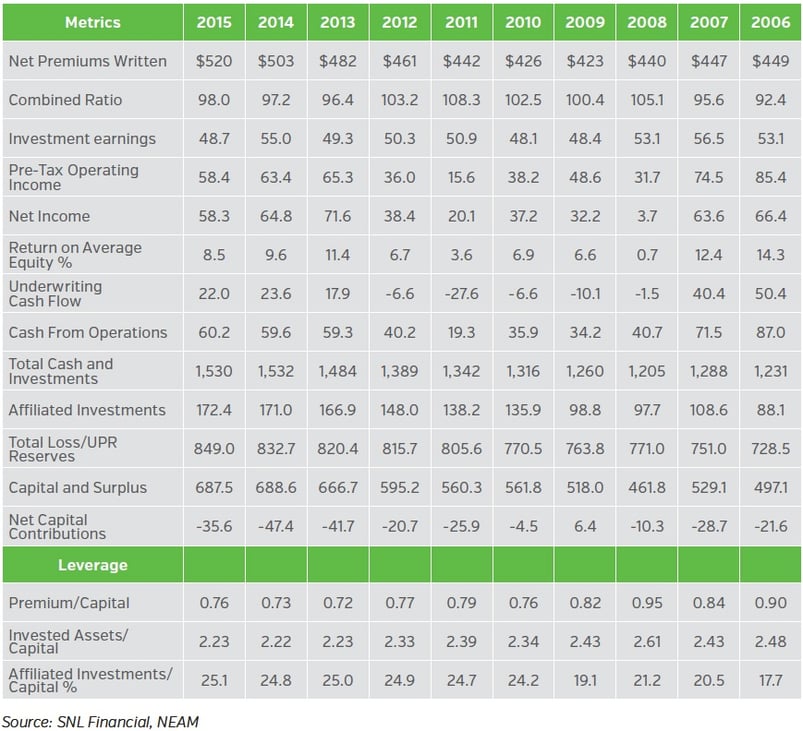
Chart 1 displays the decomposition of statutory investment results into two key components: earned investment income and realized/unrealized capital gains and losses. Earned investment income decreased over $6 billion, as (affiliated) dividend income (not shown) declined over $7 billion. Nearly all the decline in affiliated income can be attributed to one organization, Berkshire Hathaway2. All major sectors’ earned investment income declined in 2015 except for Other Income (essentially BA assets).
Net capital gains fell to (-$11.8) billion as net unrealized losses of $27 billion overwhelmed net realized investment gains of approximately $15 billion. Unrealized losses were concentrated in unaffiliated equities and bond holdings. Realized gains occurred primarily in unaffiliated equities and Schedule BA assets. However, net gains were also realized within both the taxable and tax-exempt bond holdings, accelerating the decline in fixed income current and prospective book yields.
Chart 1. Statutory Investment Results Before Taxes ($ Billions)
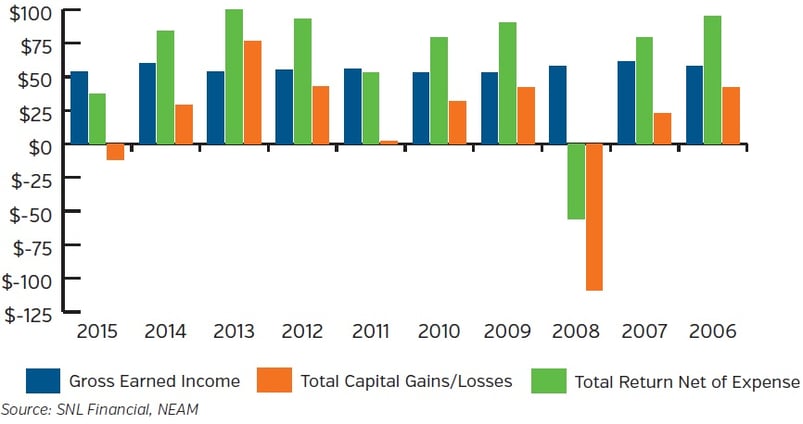
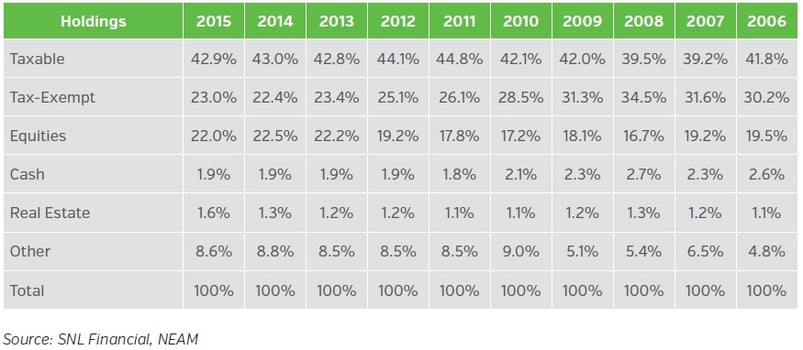
Table 2 shows the asset allocation across broad sectors. These allocations are essentially unchanged over the last three years. Over the 10-year period, major changes include: a decline of tax-preferenced municipal allocation, increased equity allocation (both affiliated and unaffiliated holdings) and the 2010 sharp increase in Other (Schedule BA) assets (due principally to one organization). The continued low allocation to municipals is perplexing given more recent improved underwriting results.
Table 2. P&C Broad Sector Asset Allocation
We define “risk” assets as common and preferred equities, Schedule BA assets and below investment grade fixed income securities. Table 3 summarizes these holdings. As a percent of capital, 2013-2015 allocations remain below the 2001 peak value of 79% (not shown). And, whether the “risk” asset metric includes or excludes affiliated investments there appears to be no impact on trends or ownership concentration.
The often heralded Schedule BA “alternative investments” as a panacea to the low-interest-rate environment remains greatly overstated: Berkshire Hathaway very much impacts the industry profile and there is also extreme ownership concentration of the remaining holdings. Illiquidity, lack of transparency, volatility and capital charges might hinder widespread ownership. We believe advocacy of alternatives needs to be assessed in the context of the enterprise capacity for more liquid (tax-preferenced) securities and astute capital management of leverage. The decomposition of Schedule BA and other “risk” assets will be a subject of a subsequent issue of Perspectives.
Table 3. P&C “Risk” Asset Allocation
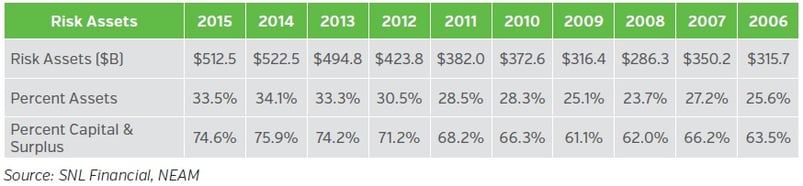
Table 4 shows earned investment income by broad asset class. Total earned income in 2015 decreased $6.2 billion from the prior year. This was due to a decline of (affiliated) equity earned income, which was only partially offset by an increase in the “All Other” (Schedule BA) category. These changes were due primarily to Berkshire Hathaway. The gross bond book yield declined 13 basis points (bps) to 3.44%.
The decline in book yield represents a decrease of nearly 150 bps from 2007-2008 and over 290 bps from the late 1990s (not shown). The significance of the decline is twofold: first, the low-yield environment offers scant earnings relief to fragile, though favorable, underwriting results; and second, the timeline to achieve a more robust embedded portfolio book yield continues to extend even if anticipated rising rates occur.
Table 4. Earned Investment Income by Broad Asset Class ($Billions) and Bond Gross Book Yield
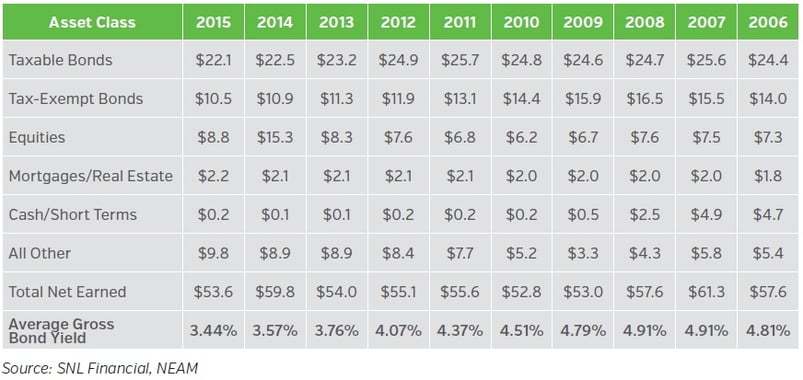
Table 5 displays fixed income sector allocations. The retrenchment in municipal tax-exempts has been significant since 2008, possibly reflecting uncertainty regarding the sustainability of recently profitable underwriting margins. Declining Gov’t/Agency allocations might reflect their increasingly uncompetitive yields. The corporate bond allocation increases reflect the mirror opposite of municipal and Gov’t/Agency allocations. Total structured securities remain largely unchanged although their underlying composition has been altered.
Taxable municipal, non-dollar and private bonds are shown in the “Other” category. In aggregate, these sub-categories totaled $65 billion at year-end 2015, representing an $8 billion decline from 2014. Non-dollar securities declined $7 billion. The ownership of non-dollar and private bonds remains very concentrated among a few companies: 80% and 90%, respectively, are owned by 10 groups. Taxable municipals are more widely owned and the allocation to these increased by more than $1 billion.
Table 5. Fixed Income Sector Allocation
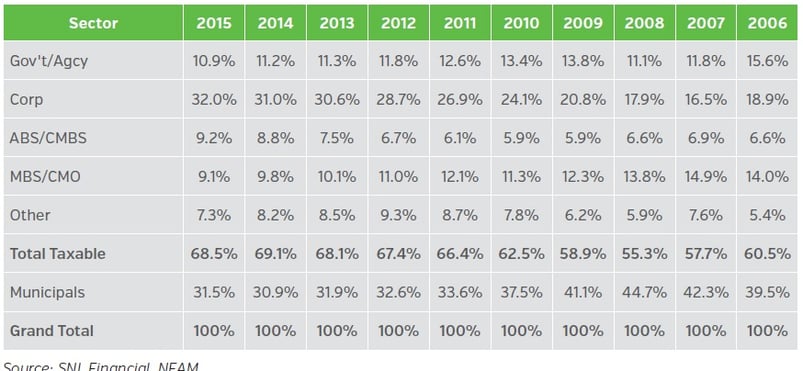
Table 6 displays option adjusted duration (OAD) for fixed income sectors. The OAD statistics are based upon Schedule D holdings and exclude any holding company bonds or derivatives. Over time, the duration differential between tax-preferenced and taxable bonds has averaged in excess of 2.5 years. Within the taxable sector, only ABS/CMBS experienced a significant duration change and this was directionally in line with the BofA ML ABS/CMBS Master Indices’ market cap-weighted duration increase of .58 years during 2015.
Municipal bond OAD increased 0.43 years during 2015 in contrast to the prior year’s 0.71 decrease. For 2014, the duration change was directionally consistent with the BofA ML Municipal Master Index OAD 124 year decline. In 2015, the opposite was the case: the industry’s municipal duration increased 0.43 years while the index’s duration declined 0.11 years, suggesting a proactive duration extension. The impact of purchases and sales varies by individual companies.
Table 6. Fixed Income Sector Option-Adjusted Duration (OAD) – Excludes Non-rated Bonds
Tax-preferenced municipal bonds remain an important asset class, but with very uneven ownership. Table 7 shows that municipal bonds represent 50% to 75% of 57 companies’ bond portfolios. These same companies owned about 42.8% of the industry’s tax-exempt bonds and, on average, represented 59.3% of their fixed income holdings. Their numeric average and dollar-weighted OAD were 5.95 years and 6.28 years, respectively. Prior articles show that profitable underwriting organizations invest large portions of their portfolios in longer dated municipals.
Table 7. 2015 Municipal Bond Holding Distribution
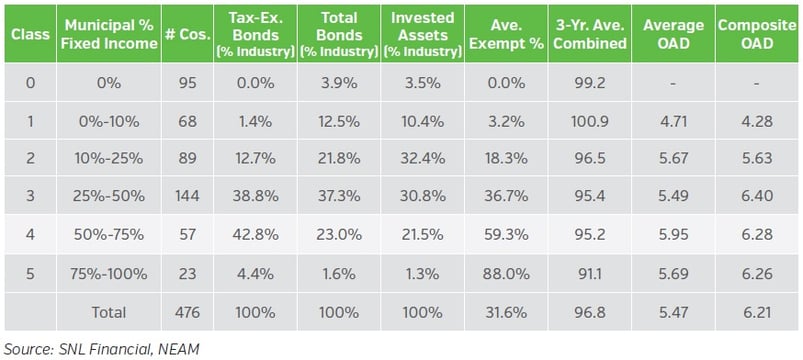
Table 8 displays municipal bond total return performance contrasted to that of the broad taxable market using BofA ML indices from 1990-2015. The performance metrics are shown on an after-tax basis. Total return is divided into its key components: price return and income return. Municipal bonds historically have higher after-tax return with less volatility at nearly comparable duration than do broad market taxable bonds. We believe Municipal holdings enhance a fixed income portfolio’s after-tax return/risk profile, and are an underutilized asset class (as are structured securities).
Table 8. Municipal Bond versus Broad Market Returns
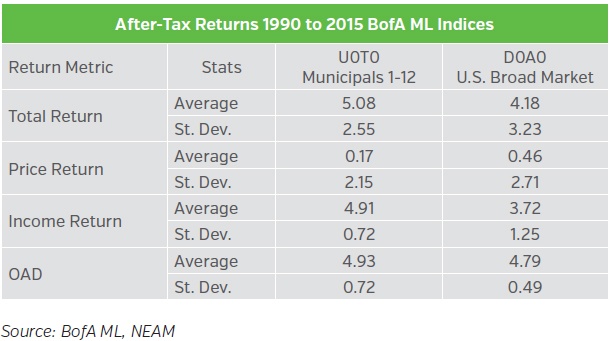
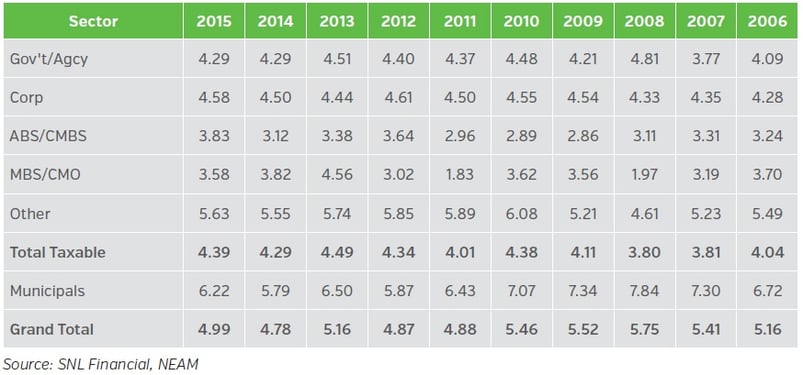
Table 9 shows book yield by fixed income sector. Across all sectors the aggregate decline in book yield was 10 bps, the lowest since 2008. Taxable book yields declined only 5 bps, whereas municipal book yields declined 19 bps, the largest amount since 2012. Within the taxable sector, book yields were unchanged for AAA/AA rated securities, and down 7 bps, 8, bps and 42 bps for single-A, triple-B and below investment grade securities, respectively (not shown).
Within the municipal sector, the decline among AAA/AA and A rated securities was similar at 19 bps and 21 bps, respectively. And for triple-B and below investment grade holdings, the respective declines were 35 bps and 25 bps (also not shown). In part, the reduction in yields was “self-inflicted,” reflecting gains that were taken during the year3. “Harvesting” gains, accelerating taxes (and increasing marginal rates) and suppressing future income and book yields have been a re-occurring phenomenon among select companies for many years.
Table 9. Fixed Income Sector Book Yield – Exclude Non-Rated Bonds
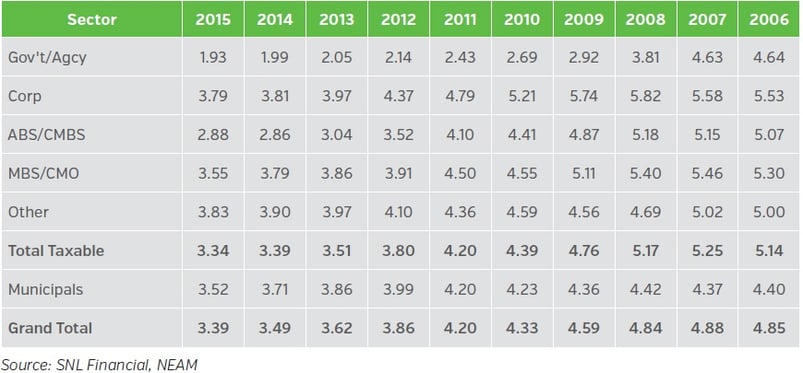
Of particular note from Table 9 is that the gross book yields of municipal bonds continue to exceed those of taxable bonds. This is a trend that follows a breakeven year in 2011. Note that prior to 2011 the duration differential (Table 6) often exceeded three years, enabling the municipal portfolio to accumulate high book yield bond which in future years would exceed available taxable bond market yields.
Chart 2 displays the taxable and tax-exempt gross yield for the 220 largest company groups that individually own at least $40 million in both taxable and tax-exempt bonds. The data demonstrates the widespread book yield differential. For entities to the upper left of the green line, tax-exempt book yields exceed those of taxable bonds. The yield differential is driven by duration and purchase date. Credit quality is not a factor: the industry’s municipal holdings have a significantly higher credit quality distribution than taxable holdings.
Chart 2: 2015 Taxable and Tax-exempt Book Yields
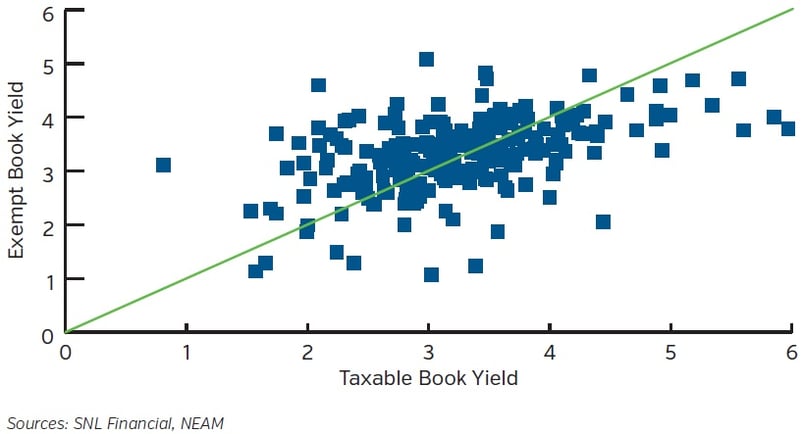
Chart 3 displays fixed income credit quality. As we have noted in previous issues, the 2008 fixed income credit quality shows widespread reduction of triple-A securities, reflecting corporate and structured securities downgrades. The 2011 reduction in triple-A securities reflects Standard and Poor’s downgrade of U.S. Government securities. In 2012 credit quality weakened as a consequence of purchases, not downgrades. This behavior commenced in 2011 and continued through 2015. At year-end 2015, the combined triple-BBB and below-BBB securities’ allocation of 19.9% was nearly three times the 2006 amount of 6.9%.
Chart 3. Fixed Income Credit Quality
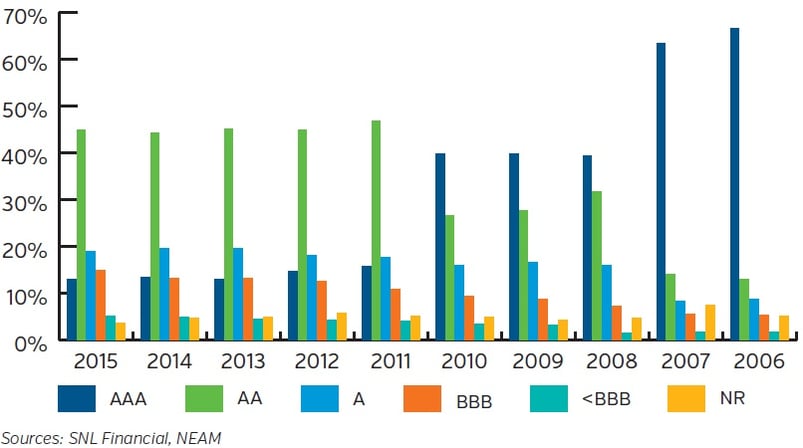
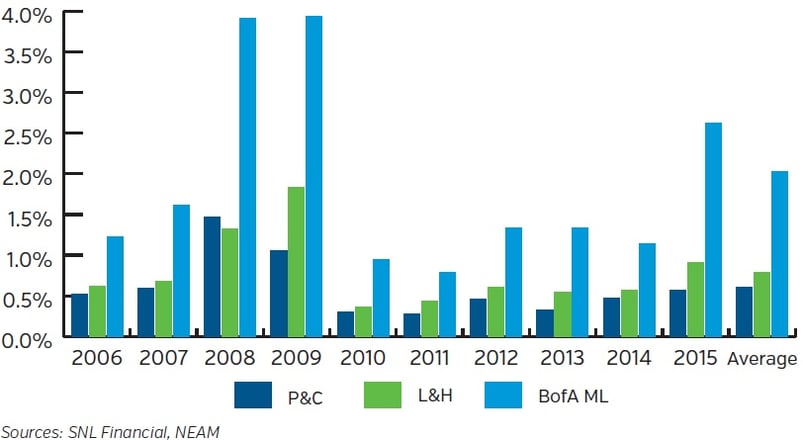
Chart 4 displays corporate bond downgrades to below investment grade ratings. We use the BofA ML Investment Grade Corporate Index C0A0 to benchmark property-casualty and life insurance company results. The benchmark’s downgrades range from a low of .79% in 2011 to a high of 3.94% in 2009. The 2015 downgrades to below investment grade increased to 2.63% of total par value from 1.14% the prior year.
The property-casualty insurance industry downgrade percentages range from a low of .28 in 2011 to a high of 1.47 in 2008. In 2015, the downgrade percentage increased to .57 from the prior year of .47. The life industry investment grade corporate bond credit profile has greater skew to longer dated and lesser quality ratings than the property-casualty industry. Life industry downgrades ranged from a low of .36% of par value in 2011 to a high of 1.83% in 2009. In 2015, the downgrade percentage increased to .91% of par value.4
Chart 4. Known Corporate Bond Downgrades to Below Investment Grade
Key Takeaways and Preview of Future Topics
Highlights of this Perspective’s review include:
- Nominal underwriting margins and continued low prospective investment returns, combined with very low leverage, limits the industry’s prospective return on equity to mid-single digit levels.
- Investments in non-traditional assets remain low, highly concentrated and illiquid.
- Credit quality has significantly eroded over the last decade with a near trebling of triple-BBB and below investment grade securities.
- Tax preferenced municipal bonds (and possibly structured securities) appear to be underutilized assets.
- Book yields continue to decline as higher yielding securities have been sold (especially tax-exempts) and/or matured and capital market replacement opportunities at comparable yields are not available.
- Low embedded yields, the maturity structure of portfolios and nominal operating cash flows will significantly extend the time to restore investment income.
We believe it is to an insurer’s advantage to adopt an enterprise capital management approach to optimizing asset allocation. This should encompass a comprehensive vetting of investment guidelines, a more complete integration with enterprise risk appetite and tolerances, and consideration of capital structure and management.
This Enterprise Based Asset Allocation review needs to be integrated with the organization’s business planning efforts to assure operational acceptance and successful execution. The review needs to incorporate realistic (achievable) underwriting goals and prospective capital market outcomes. Future property-casualty insurance Perspectives will offer case studies.
We welcome your feedback and comments. Please contact us if there are investment themes you would like us to review or if you would like to receive a personalized comparative assessment, HealthCheck, of your investment portfolio
1 Occasionally, we will reference results not appearing in charts and tables to explain the information that is actually presented. These details are available upon request.
2 Berkshire Hathaway in subsequent sections will occasionally have a notable impact upon industry results.
3 The gross earned yield shown in Table 1 annually overstates actual book yield on average by 13 bps per year over the last 10 years. Gross earned income includes all bond income including that from bonds matured or disposed of during the year. Book yields shown in Table 9 represent the sum of book value weighted book yields of the bonds owned at year end.
4 The methodology used to measure insurance industry downgrades to below investment grade levels has a bias to understate downgrade activity. For that reason, it is difficult to make cross-company comparisons and caution is advised in reviewing the results relative to the benchmark. For all bonds the acquisition date is known and downgrades are known only for holdings owned at year-end. Thus, bonds bought and sold during the year are excluded. Similarly, bonds owned at the beginning of the year (prior year-end) but not at the following year-end are excluded. This is because the sales date is unknown (from year-end holdings data) and the downgrade may have occurred after the bond was sold. The industry’s performance relative to the index begs the question: “Who were the unfortunate investors suffering the downgrades?”


