
Our recent Perspectives focused on 2015 property/casualty insurers’ investment highlights and led us to reach the following conclusion: It is to an insurer’s advantage to adopt an enterprise capital management approach to optimizing asset allocation which encompasses a more complete integration with enterprise risk appetite and tolerances, a comprehensive vetting of investment guidelines and consideration of capital structure and management.
These two points within the summary serve as background for this issue of Perspectives.
- Nominal underwriting margins and continued low prospective investment returns, combined with very low leverage, limit the industry’s return on equity to mid-single digit levels
- Tax-preferenced municipal bonds (and structured securities) appear to be underutilized assets
In the first of five sections, we present the framework and historical context of drivers that will generate returns for insurers. Next, we describe our approach to estimate prospective investment returns and provide forward-looking underwriting margins for clients; and then present several enterprise-based asset allocation options to compare and contrast results. The fourth section shows the impact of actively managing the leverage drivers within the enterprise return and risk framework. We close with a summary of results and additional considerations.
Enterprise Return Framework and Historic Perspectives
The basic framework of this Perspectives review begins with DuPont’s decomposition of an insurer’s enterprise return on equity into its four principal components: premium leverage (ratio of premium to capital or P/C), underwriting margin (100 minus the combined ratio), investment leverage (ratio of invested assets to capital or IA/C) and investment return (percentage of return on invested assets).
Underwriting and investments are the sources of enterprise return and risk, and their impact upon capital is amplified by their respective leverage1 Other revenue and expense streams can be appended to this basic formula (such as premium finance income and debt-servicing costs). However, these are the four essential ingredients. And, it is understood that they are inter-related: an erosion of either underwriting margins or investment returns changes both premium leverage and investment leverage, not just the related component.

Both ratios peaked in 1973 at levels of 2.7 and 4.4, respectively. Since then, the ratios have been trending downhill, reaching all-time lows. The environment of the last 20 years is the one most familiar to today’s insurance leadership.
Chart I U.S. Property/Casualty Industry Premium and Invested Assets Leverage Ratios 1951 - 2015
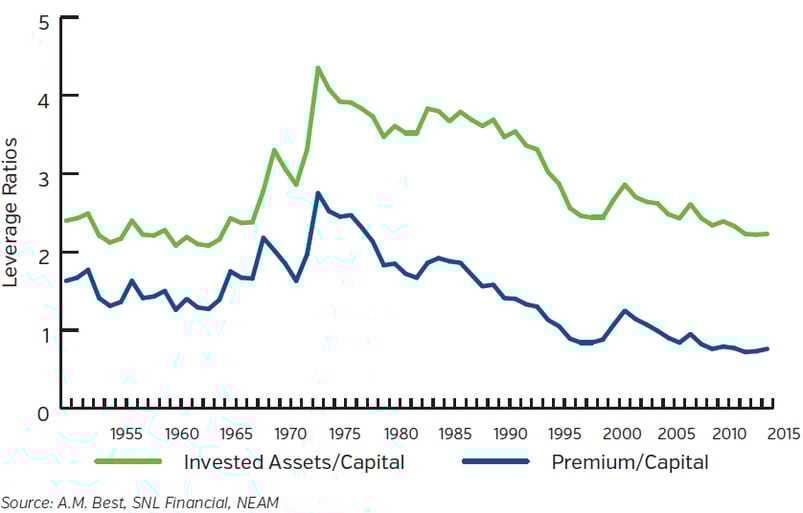
Chart II shows premium and investment leverage ratios for the 480 largest insurers as year-end 2015. The “red” dot represents a target company, while the “gold” dots represent the nine largest companies. Although there is wide variation among insurers, there are few whose premium or investment leverage is even close to the levels of the late 1960s through the 1980s (1.7 and 3.0+, respectively). That said, there are companies operating that have multiples of other firm’s leverage. The former companies will have an advantage in pursuing higher returns on capital, though misses in underwriting margins or asset returns will prove to be more damaging to their capital positions.
Chart II Premium and Investment Leverage of 480 Largest Property/Casualty Companies
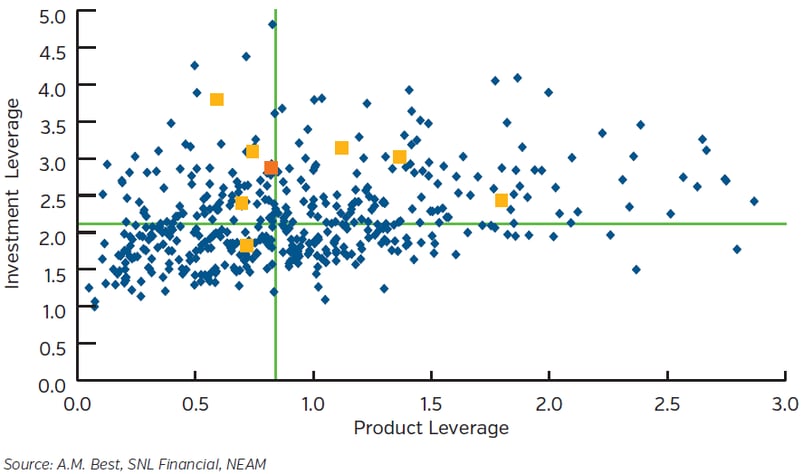
Chart III displays the industry’s combined ratios and capital market fixed-income yields. The combined ratios are reported calendar year values both with and without estimated natural catastrophes. The capital market’s fixed-income yields are a blend of short-and long-term investment grade indices.
Chart III U.S. Property/Casualty Industry Combined Ratios and Fixed-Income Yields 1951 - 2015
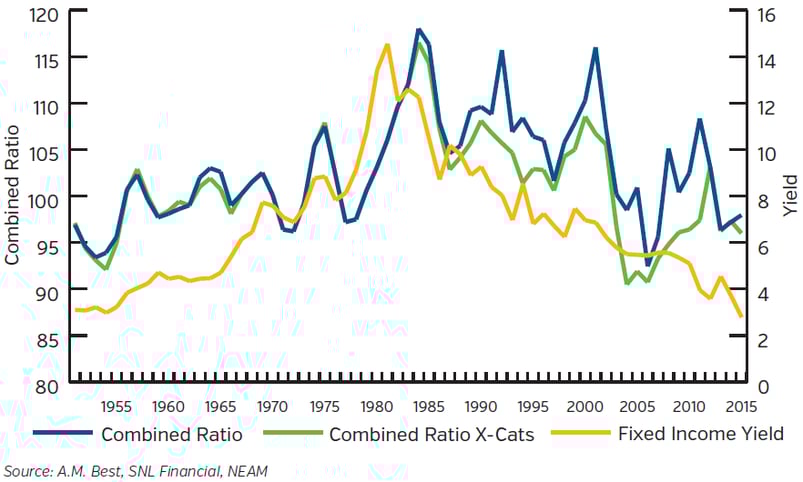
In Chart III the escalation of combined ratios and yields in the 1970s reflects social and rampant economic inflation and judicial contract reform. The 1992 and 2001 calendar years reflect both catastrophes (Andrew and 9/11) and associated recording of prior year development. Hurricane Sandy had an impact in 2011 and 2012. The combined ratios and yield data highlight inherent volatility in both insurance and capital markets and the near secular behavior of yields. This begs the question: What’s next?
Prospective Investment Returns and Underwriting Outcomes
Unfortunately, continued uncertainty is next, and levels are unknown. The enterprise framework harnesses investment return expectations and underwriting margins, combining them with volatility estimates, to produce a range of leveraged return/risk profiles which are then stress tested. What is the process?
NEAM derives prospective investment returns using methods similar to Economic Scenario Generators (ESGs), which combine investment return mean reversion assumptions and in-depth analysis of economic and market technical indicators with “expert” qualitative judgments to derive multi-year rate, spread and equity valuation estimates. The estimation process is scalable, transparent and repeatable.
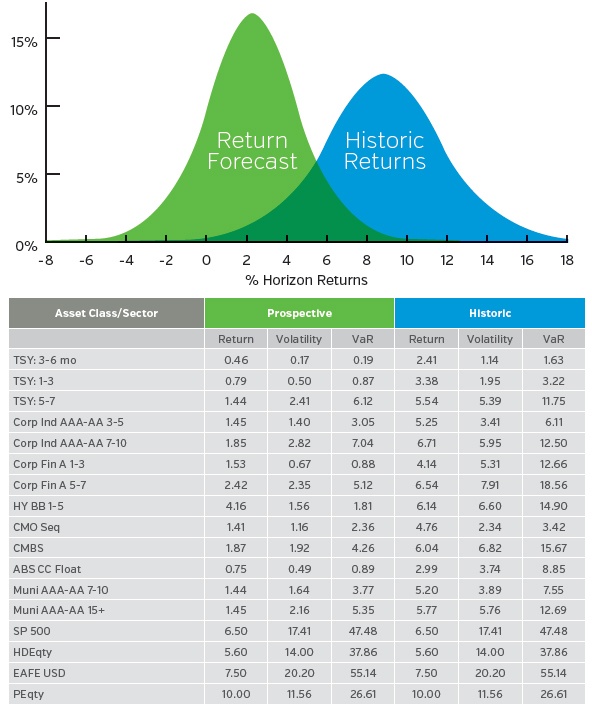
Figure I depicts hypothetical distributions of historic and one year forward total returns. The prospective distribution is characteristic of most fixed income assets in an environment of low rates, expectations of slight rate increases and nominal spread movements. Similar distributions of forward returns are compiled for equity investments enabling estimates of combined fixed income and equity portfolios’ return distributions.
The table adjacent to the chart in Figure I displays total return, volatility and value-at-risk (VaR) estimates for representative fixed income and equity asset classes on both a historic and prospective basis2. Although not shown for reasons of space, total returns reflect estimates for both income and price change. For fixed- income assets, there is a need to account for duration and book income migration of existing asset holdings in addition to purchases to replace assets maturating, paying down or called.
Figure I Sample of Historic and Prospective Returns
The methods allow for multi-period estimates. However, the longer the time horizon, the greater our skepticism. The estimates used in the enterprise framework are the outputs of NEAM’s investment policy process, which places a premium upon real world investment decisions. This is not a “modeling” exercise, but rather a component of an actual investment process. That noted, the method per se is not as important as the eventual scrutiny of the enterprise applications’ outcomes by applying multiple stress-test methods.
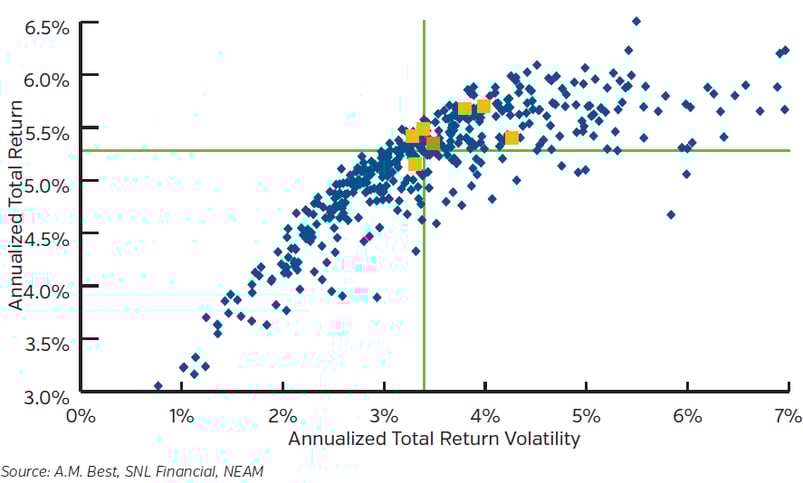
Chart IV shows the prospective return and risk estimates of the 480 largest property/casualty companies’ 2015 holdings. The red intersecting line reflects industry median values. The chart suggests ample opportunity for many individual insurers to improve their investment portfolio’s return/risk profile.
Chart IV One-year Forward Expected Investment Total Return and Volatility for Individual P/C companies
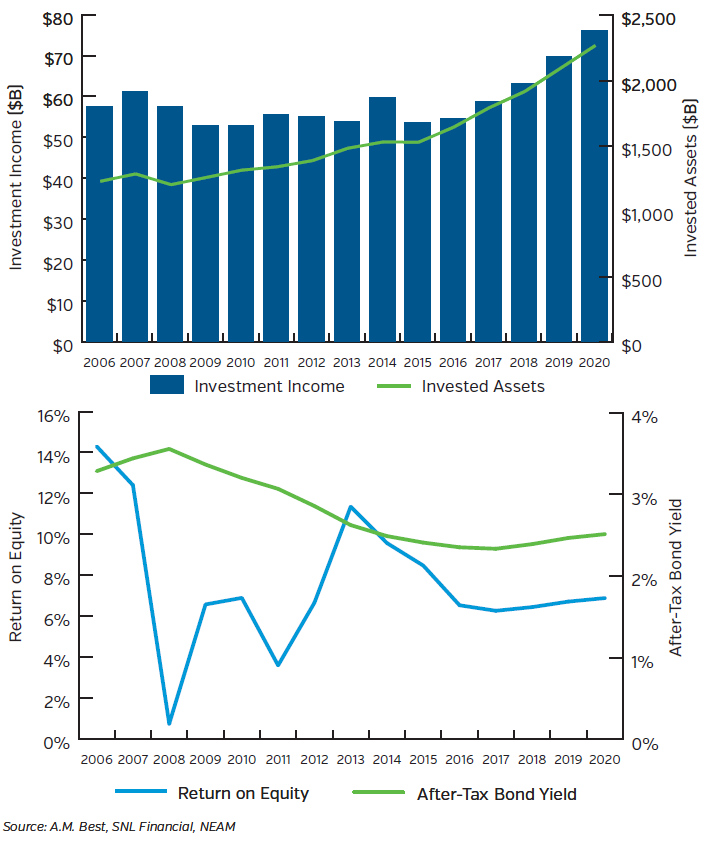
In the absence of re-examining enterprise capital return and risk management opportunities, the outlook for investment earnings is very difficult. This is illustrated in Figure II which displays historic and prospective industry book yields, investment earnings and return on equity in the context of rather benign underwriting results of 4.5% premium growth and a 97 combined ratio3. Earned investment income returns to 2007 peak earnings years in 2018, but only because the asset base is more than 45% larger. Neither gross income yield nor after-tax book yields are projected to achieve anything close to historic pre-financial crisis levels. And, return on equity remains in the lower mid-single digit levels during the 2016 – 2020 period.
Figure II P/C Industry Earned Invested Assets, Earned Income, After-tax Book Yield and ROE 2006 - 2020
Asset Allocation Options
Underwriting margins and their respective estimates of volatility and downside risk are essential to developing an enterprise-based asset allocation. Most often these are provided by client companies as part of their business planning process. They are frequently sourced from their internal economic capital or pricing and reserving models, sometimes with the assistance of third-party consultants or reinsurers (intermediaries).
Combining estimates of underwriting margins with those for invested assets and accounting for leverage better enables companies to identify, measure and manage the return/risk trade-offs (net of taxes) across the enterprise. This ensures that insurance operations and investment activities are consistent with stakeholder return expectations and risk tolerances. Figure III depicts return/risk trade-offs based upon 2015 year-end property/casualty industry holdings, product mix, leverage, a 3% underwriting margin (97 combined ratio) and assuming a full rate tax-payer similar as above.
Figure III 2015 P/C Industry Enterprise – Potential Asset Allocation Options
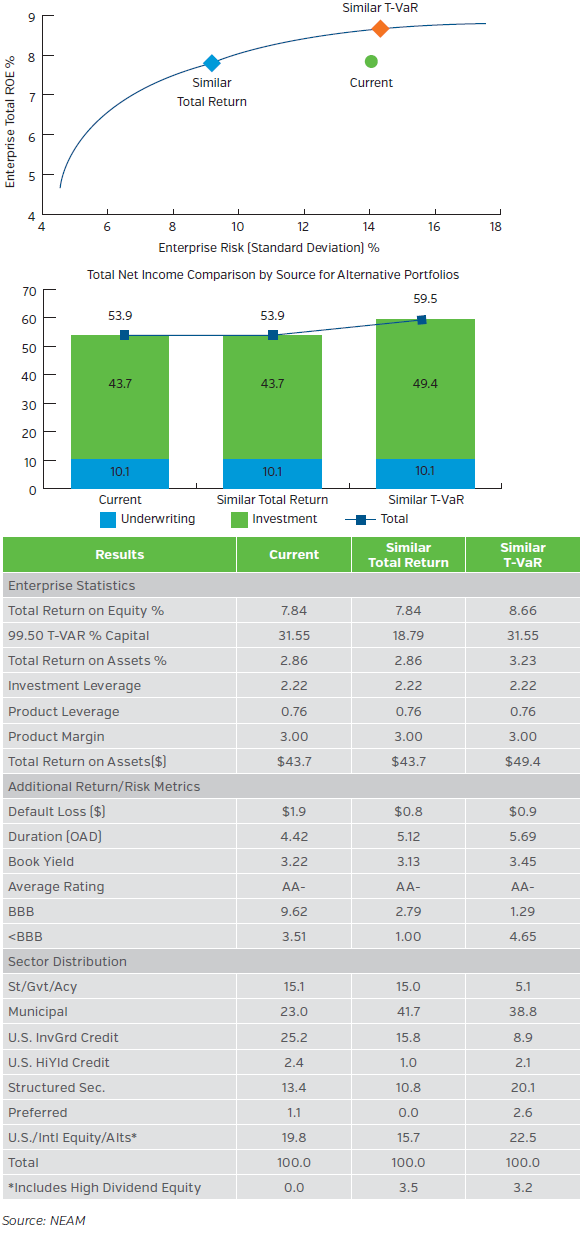
The enhanced asset allocation above emphasizes tax-preferenced securities such as tax-exempt municipals, preferreds and high-dividend equities. The allocation to these assets increase significantly from current levels to similar earnings and enterprise T-VaR levels, with return on equity rising nearly 100 basis points. Whereas suppressed interest rates have pressured insurers’ earnings, eligible assets remain to improve operating results. These opportunities have persisted due to favorable tax treatment and ensuing relative value in most yield and spread environments. Accordingly, companies blessed with well-managed underwriting operations might be able to “double dip” to improve their overall financial performance.
Capital Management
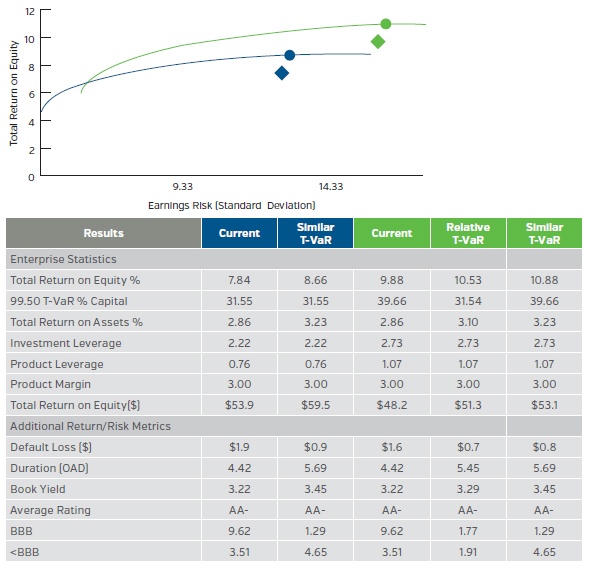
Capital management (embedded within NEAM’s Enterprise Capital Return and Risk Management® framework) is a very powerful tool, especially for organizations placing a greater emphasis upon return on equity rather than absolute dollar returns. Figure IV contrasts enterprise and other metrics attributable to recent levels to pre-millennial levels. The notable differences are the trade-offs between rates of return and dollars of return. The former are higher and the later are lower as leverage is increased. In the higher leverage scenario, even at a T-VaR similar to the lower leverage scenario, the rate of return on equity (10.53) is notably higher than the former (8.66). At the end of the day, it is all about trade-offs.
Figure IV 2015 P/C Industry Enterprise – Potential Capital Management Opportunities
There are several takeaways from this Perspective’s review:
- Operating leverage (premium to capital) and investment leverage (invested assets to capital) continue their downward spiral from peak levels of the early 1970s. Capital withdrawals remain low except for recent years.
- Underwriting margins are only episodically favorable, with volatility accentuated by catastrophe losses and occasional serious missteps in pricing and reserving estimates.
- With prolonged low market yields or even modest multi-year interest rate increases, insurers’ book yields will continue to decline and investment income will only increase due to premium-driven invested asset accumulations
- Nominal underwriting margins and continued low prospective investment returns, combined with low leverage, limits the industry’s prospective return on equity to mid-single digit levels.
- Against this backdrop, there are causes for optimism for some (not all) insurers, as noted by the wide dispersion in underwriting margins, investment returns and leverage among companies…there are firms achieving exceptional risk-adjusted returns, consistently.
- Companies with superior underwriting results providing capacity for tax-preferenced income may potentially be able to further improve their risk-adjusted after-tax total return by increasing their asset allocation to tax- exempt municipals, tax-advantaged preferred stocks and high-dividend equities.
- In the absence of underutilized tax capacity, companies with access to investment expertise in structured securities might wish to explore that as an asset allocation opportunity to improve prospective returns.
- Lastly, there are capital management opportunities, not favorably viewed by all, but available to firms seeking to increase the efficiency of their capital utilization. Share buy backs, debt and M&A are matters of consideration for some companies; we reviewed the possible consequences of one such approach.
We welcome your feedback and comments. Please contact us if there are investment themes you would like us to review or if you would like to receive a comparative HealthCheck of your investment portfolio
1 It need not be “all about return.” Rather, as in the case of some mutual and captives, the emphasis upon preservation of capital is a frequent and consistent application of this framework.
2 In practice, forward-return estimates and associated statistics are derived from actual lot level holdings. In the following section, forward estimates for investment alternatives are based upon industry proxies.
3 Please see General ReView Issue #74 from January 2016: “Investment Highlights: Rehab–The Long Road to Recovery,” for more in-depth review, as combined ratio assumptions due to attritional losses and catastrophes vary.


